Quantcast
Channel: HDA betting – Soccerwidow
Viewing all 44 articles
Browse latest View live

1×2 Betting System: Analysis of HDA Data and Strategy Development – LAY THE DRAW

$
0
0

Numerous Web sites and forums pay homage to the Lay The Draw strategy with prolific threads from supporters claiming to have found extremely lucrative 1×2 betting systems. Therefore, I have decided to explore lay the draw betting in detail using our HDA Simulation Tables and the popular betting odds Value Bet Calculator.

Firstly, I will say that it is certainly possible to find a winning Lay The Draw system. However, it requires not only an excellent feel for the 1×2 betting odds market but also, knowledge of exactly what to look for and how to filter out a promising football betting system from a jumble of data.

In this article you will learn the most common approaches bookmakers use to set their 1×2 betting odds, focusing on the draw odds. I will explore examples from the EPL and compare market prices with the ‘true’ odds. Using this knowledge together with findings from the HDA Simulation Tables, I will identify one team which looks very promising to lay the draw in each of its home league matches for the forthcoming season.

Lay the Draw – English Premier League 2008-09 to 2012-13

Here is a screenshot from our HDAFU simulation table for the English Premier League (just one of 20 tables in the fixed win – fixed risk staking plan tab):

Lay The Draw Betting Results - EPL 2008-09 to 2011-12

Lay The Draw Betting Simulation Results – EPL 2008-09 to 2012-13

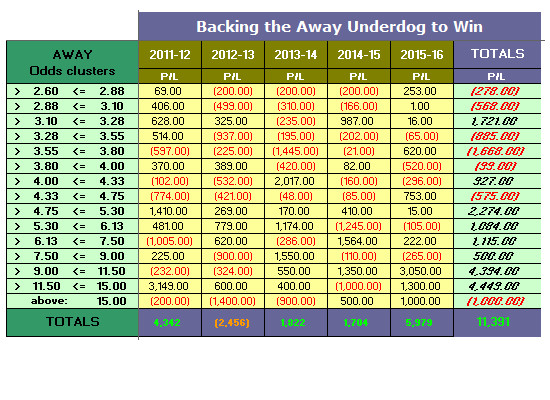
In the last five seasons, if a bettor decided to lay the draw in every EPL match for a fixed risk of 10 units (fixed risk = limiting each bet to lose the same set amount; profit therefore fluctuates with each bet), a loss of 380.42 units would have been observed. The many red numbers in this table are difficult to ignore.

Only by specialising in laying the draw consistently for the two Manchester clubs (City and United) when both (or either) were playing at home, would the bettor have seen a profit after five seasons (118.04 units for City; 143.85 units for United).

A profit would have been rather unlikely if he had chosen a combination of any of the other teams. Including teams such as Fulham, West Brom, and West Ham when playing at home may have improved the chances of a profit but, their positive results after five seasons are not as promising as the two Manchester teams.

For all the other teams scheduled to be playing in the 2013-14 EPL season (all those with a yellow background to their name in the table will be playing in the new season), there are only red numbers including Arsenal, Chelsea, and Tottenham, although their negative results are not quite so bad as the others.

Why do Some Teams Bring Lay The Draw Profits and Others Not?

To understand why some home teams bring a profit when laying the draw and others not requires a deeper understanding of football betting odds calculation.

It is a hard fact, but true: There is no universal formula for successful football or sports betting in general. There is no rule that applies to every team and every market without exception which is always profitable to use. It is not possible to automate sports betting picks. You must look at each team individually and attempt to understand the bookmakers’ approach when they are setting odds.

It is crucial to remember and bear in mind that bookmakers live from offering sports bets. They need to ensure long term solvency despite advanced computer technology, the availability of more and more raw statistical data, and the increasing mathematical awareness of their customers.

The main business objective of bookmakers is ensuring profit, paying the bills and employees’ wages, and attempting to keep gamblers happy and entertained.


Understand Betting Odds Calculation

Bookmakers’ football betting odds are mainly based on historical statistics and also on public opinion. Bookmakers need to balance their books so they are not exposed to losing considerable sums on any particular outcome.

However, some teams neither obey their previous seasons’ statistical trends, nor comply to opposing teams’ statistics, or even to league averages. Some teams have a huge and unique home-field advantage; others just do not travel well. Whatever the set of factors involved in individual games the formulas which govern calculations of draw odds sometimes don’t reflect satisfactory market expectations.

Of course, you cannot fully eliminate the chances that now and again a match finishes in a draw, but this is observed far less frequently than mathematical formulas predict or as indicated by the bookmakers’ odds. Sometimes, betting odds offered in the market are repetitively too low for some teams and therefore great value can be gained if one succeeds to identify them and choose to lay the draw whenever they play at home.

The following table is a comparison of the average distribution of the draw in the English Premier League with the observed distribution of three selected teams: Arsenal, Manchester United, Tottenham:

1x2 Betting System - Lay The Draw EPL Screenshot

EPL Draw Distribution 2008-09 to 2012-13

You can see that Arsenal are a good example of a team that “more or less” sticks to the average distribution season after season. There were no major deviations except in the 2009-2010 season. This means that positive betting results for Arsenal draw lays are fairly unlikely. If you can remember the table on the previous page, Arsenal’s red figures now seem justified.

Bookmakers therefore succeed quite well in pricing Arsenal’s home games and they are able to set the odds in a manner which, at the end of a season, show no great variations and the expected distribution matches quite reasonably the observed results.


Finding Betting Odds Inflection Points – Bet and Win

$
0
0

Inflection points are the points at which the curvature or concavity on a curve changes from plus to minus or, from minus to plus. Translated into layman’s language – the turning points on the profit/loss graph where profits turn to losses or, where losses turn to profits.

Inflection Points in Football Betting

If you have ever calculated your own odds you will certainly have noticed that bookmaker prices often do not show the ‘true’ picture.

Sexy female teacher with abacusImage: FXQuadro (Shutterstock)

In other words, their odds seldom adhere to ‘true’ mathematically calculated values (the statistically expected values).

In the majority of games, odds are either higher than mathematically expected or lower…

Why Is This So?

A bookmaker’s aim is to make a profit and they price their odds to ensure that sufficient action is taking place on both sides of a bet, with enough profit retained whatever the outcome.

In addition, bookmaker betting odds are often aligned to public opinion to guard against a disproportionately large amount of money being placed on just one side of a bet.

Thinking this through with a mathematical mind, it seems very plausible that there must be certain odds clusters which are regularly under-priced, whilst other odds clusters are habitually over-priced.

The evidence to support this ‘theory’ can be easily spotted in the HDA Simulation Tables using visualisations (see example below) in the form of Profit/Loss curves based on the data within these tables.

For example, the EPL: Between 2009-2014, if you had gambled unemotionally and systematically on all English Premier League matches to be home wins (at average bookmaker odds) and placed a constant stake of 100 units per fixture, then at the end of the fifth season, your losses would have accumulated to -3,157 units.

Even higher losses would have been incurred backing all home teams to win if you would have limited your betting to the zone of odds between 1.49 and 6.53. Within this zone your losses would have totalled -7,711 units (198 plus 7,513).

However, if your strategy had been based on home wins at odds below 1.49 and above 6.53, after five seasons your profit would have been 4,554 units (7,513 minus 3,157 plus 198).

Inflection Points for Home Wins for the EPL

EPL 2009-14 - PL home odds inflection pointsEnglish Premier League – Profit/Loss curve for 2009-10 to 2013-14 seasons

The above screenshot shows the Profit/Loss curve for the EPL if back bets (at average bookmaker odds) were placed on all 1,900 matches between 15/08/2009 and 11/05/2014 (at 100 unit stakes).

You can see from the graph that the first real turning point is at home odds of 1.49. The P/L curve reaches a peak of 198 units profit before starting to fall. The erosion of profits continues until home odds of 3.49 are reached (P/L value: -7,084 units), where the curve turns for a spell before dropping again and reaching its final inflection point at odds of 6.53.

This type of graph is of great help in visualising profits and losses and in this case, the curve shows that in this odds group (60% of the matches), bookmakers under-price home team wins. Bookmakers make a long-term profit, whilst bettors lose more than they win.

The interpretation is that ‘home win’ bets must be quite popular on EPL matches at odds between 1.5 and 3.5, and bookmakers react to this high demand by reducing prices. Of course, this also means that the odds on other sides of the bet (draw and/or away win) must then be increased.

Working Out Inflection Points using the HDA Tables

Here’s a handy little tutorial:


How to Use the Knowledge of Inflection Points

(1) check your own betting pattern

Do you recognise your own betting patterns within the most common odds clusters; those which show a falling Profit/Loss curve? (For example, backing the home team to win at odds between 1.50 and 3.50 in the EPL).

If so, perhaps reconsider your strategy and avoid the tranches of odds used by the bookmakers to make their profits. Of course, no matter how hard you try, betting in the zones where bookmakers habitually reduce prices (odds) is asking for long-term losses.

It is very rare that people succeed in any walk of life by swimming against a strong current and you can safely assume that the bookmakers know their job and have made a living from manipulating figures for centuries.

(2) don’t even try to “beat” the bookies

Swim along with them. ‘Play’ the market the same way as they do. Start looking at strategies which are not in conflict with the market, but in rhythm with it.

(3) be aware that each league has different inflection points

Customs and habits of people vary from country to country. Every nation has different cultural settings, and everybody has certainly noticed regional differences expressed in tangible goods such as food or housing.

Unfortunately, differences in betting patterns and the subsequent reaction of bookmakers when setting their odds cannot be spotted without some mathematical calculations. Customer habits, especially in the betting market, remain well hidden from the bettor.

Whichever league you prefer betting on, identify the odds clusters which are utilised by the bookmakers to make their profits – and then work around them.

(4) use the market inflection points for your own benefit

Concentrate on developing your personal betting strategy by taking the market rules into consideration.
For example, in the EPL, you may wish to look at a ‘back the home team’ strategy which embraces home odds under 1.50 or, alternatively, over 3.50, or even better, over 6.50.

(5) find a strategy and identify matches for producing long-term profits

Using the HDA simulation tables and finding the various inflection points will provide you with knowledge of odds clusters which produce a long-term profit or loss when backing.

If you already use our Value Bet Detector for calculating odds for individual matches then the knowledge of profitable odds clusters will help you to pick matches which are worthwhile re-calculating.

1×2 Football Betting – How to Compile a Winning Portfolio

$
0
0

This article moves away from betting on individual teams, and pushes strategic thinking further up the knowledge ladder.

The method described below explains how to use our HDA simulation tables for recognising profitable 1×2 betting strategies and building a portfolio from a selection of major European leagues.

Conceptual image of 1x2 football bettingImage: archideaphoto (Shutterstock)

Profitable betting on football is about compiling successful portfolios and understanding the underlying market economics.

The following analysis portrays just one successful scheme in detail – Have fun learning about market behaviour and deriving a betting system from it! 🙂

Understanding the Betting Market

It is impossible to predict with total accuracy the outcome of one particular match; however, it is possible to identify and use historical distributions of data to judge the future in general.

If you do not know what the term ‘distribution’ means, check out this article for an introduction:
Goal Distribution Comparison – EPL, Bundesliga, Ligue 1, Eredivisie

However, understanding distributions, odds calculation and probabilities is only the first step.

The next step is to understand the market economics. Just in case you missed them here are two articles describing how the bookmaker market works:-

How do Bookmakers Tick? How & Why do They Set Their Odds as They do?
How Bookmakers’ Odds Match Public Opinion

The main message of these two articles:

  1. Bookmakers set odds based on a mixture of statistical probabilities and public opinion. Effectively, their odds match public opinion.
  2. Bookmakers do not speculate (gamble). Their priority is balancing the books.


Comprehending Market Economics to Elect a Strategy to Investigate Further

Remember your basic economics lessons in school or college which were about supply and demand.

Adapt this to the football betting market: In which situations will bookmakers reduce their prices (odds), and which prices will increase as a result? Which bets are traditionally the most popular?

The fact is the majority of punters prefer betting on favourites up to odds of 2.5. Just look at online odds comparison sites which show the percentage distribution of bets on a certain outcome. It is frequently above 60% on the favourite (independent from the offered odds), if not higher.

On the other hand, consumer demand for bets on the underdog is often much lower than the actual chance of it winning.

Bookmakers are aware of this market behaviour and try their best to predict trends, time the market, and choose the best outlets for their odds. Customer behaviour is well analysed and used to generate various marketing strategies aimed at balancing the books and boosting sales.

Therefore, for the bettor, it is safe to assume that many favourites will be under-priced to win, and draws and/or away wins will be over-priced to “make up and balance the book”.

For example, a traditionally strong team like Bayern Munich playing away will, of course, attract a good deal of punters betting on them to win rather than any weaker opponent playing at home. However, most punters are normally ignorant of the fact that even teams such as the mighty Bayern Munich win approximately just 50% of their away games.

In these game constellations bookmakers, simply by following market economics, have to reduce their prices for the (away) favourites massively and balance this by increasing the price of the less fancied home team.

Investigating Distributions: Profit/Loss Inflection Points

From what has been explained in the previous chapter it should now be obvious that favourites are often under-priced to win, and draws and/or away are frequently over-priced. Therefore, it should be possible to find a workable strategy using this knowledge.

Now comes some maths… hang in there! 🙂

In the last five seasons, a total of 1,900 matches were played in the English Premier League (EPL), of which, 46.74% finished in a home win:

Table showing EPL Full-time 1x2 distribution - Five seasons 2009-14EPL: Full-time 1×2 distribution – Five seasons 2009-14

The home team was priced the favourite in 1,351 of these matches (home odds lower than the away odds), and a total of 763 games did indeed end in a home win, equating to 56.48%.

Table showing EPL: Favourite home wins - Five seasons 2009-14EPL: Favourite home wins – Five seasons 2009-14

The balance of 549 matches saw the home team priced as the underdog (home odds higher than the away odds). From these games, 125 finished in a home win for the underdog, equating to 22.77%.

Table showing EPL: Underdog home wins - Five seasons 2009-14EPL: Underdog home wins – Five seasons 2009-14

Now convert these favourite and underdog win percentages into odds:

Home wins (Favourite): 56.48% = 1.77 [European odds]
Home wins (Underdog): 22.77% = 4.40 [European odds]

The above two odds are “inflection points”, the points on a curve at which the curvature or concavity changes from plus to minus or, from minus to plus. Translated into layman’s language… the pivot points along the profit/loss curve where profits turn to losses or, where losses turn to profits.

However, these are purely the mathematical inflection points and do not take market forces into consideration.

Therefore, please do not start betting on every favourite at home priced below 1.77 in the EPL, or on every underdog playing at home priced above 4.40. (Although following this simple strategy would have produced quite a profit!).

Liquidity at Betting Exchanges – Which are the Best?

$
0
0

For serious bettors and professional traders, betting exchanges are the most convenient and reliable platforms.

Bookmakers are often very quick to limit stakes and/or close accounts of successful customers, or void individual bets or even whole markets if their books do not balance as they would like.

Man receives money from hand within laptop screenImage: NatUlrich (Shutterstock)

Don’t kid yourself – Bookmakers make a living from selling bets and to stay in business they need to ensure that more money is retained by them than is paid out to their punters. Why, therefore, should bookmakers welcome professional gamblers on their books?

On the other hand, betting exchanges profit from charging commissions. They do not care who wins or loses. In addition, the odds available are usally better than with a bookmaker.

It is therefore no surprise that professional punters use exchanges for most of their betting transactions.

However, the big question for newcomers is which exchange to choose?

This article examines the liquidity levels offered by the range of betting exchanges currently available to serious gamblers and traders.

Betting Exchanges with the best Liquidity

The selection of betting exchanges is limited. At the time of writing there are only five exchanges worth comparing: Betfair, Betdaq, Smarkets, Matchbook, and WBX.

You will also find that Matchbook and WBX are fledglings when compared to the others and thus are currently of little or no interest to professional bettors.

(1) Popular Markets in European Premier Leagues

Here are screenshots from each firm’s full-time 1×2 odds for the EPL match between Manchester United and Liverpool on 14 December 2014 – probably the biggest league game in the English football calendar each season:

These images were captured around GMT 09.30 hours (four hours before kick off) and show Betfair head and shoulders above the rest with £812,639 already matched.

Next in the list were Smarkets with a traded volume of £178,294, then Betdaq with £74,074, and WBX with matched amounts of £10,414 (back) and £15,620 (lay).

Although Matchbook’s platform is very well designed and easy to navigate, it does not display how much money has been already matched on an event. However, what you can see from our excerpt is that Matchbook showed an amount of €25,357 waiting to be matched for punters wishing to back the home team which was above the amounts displayed at Betfair and Smarkets.

For this popular market, Betfair was most definitely the winner, closely followed by Smarkets.

(2) Less Popular Markets in major European Premier Leagues

It gets trickier to find significant liquidity in less prominent markets, such as “over/under 1.5 goals”.

Below are screenshots from the same game as above, taken around the same time. Although this match was certainly followed by a massive number of fans, it is obvious that the market for over/under goals is far less popular than the full-time home, draw, or away bets.


You can spot the lack of popularity for this type of bet with Betfair; only £13,052 matched between three and four hours before kick-off. Smarkets just about troubled the scorers with £187 matched, however there was a good amount of money on offer to backers and layers – indeed, close to the amounts waiting in Betfair.

Betdaq showed no matched money at all and the gaps between the back and lay odds were huge. Although Matchbook also offered this market there was no money waiting to be matched, and for WBX, this was a market they were not offering at all.

Although Betfair was for this market the clear winner in regards of money matched, Smarkets and Betdaq had good amounts of money waiting and can be considered as serious competitors for the less popular markets in major European premier leagues.

(3) Less Marketed European Premier Leagues

Whilst Betfair is the clear leader for all major European leagues such as the EPL, Smarkets has a healthy market share in the less prominent leagues and is an attractive betting exchange for people wishing to avoid the mainstream.

For the Greek Super League game between PAOK and AOK Kerkyra, £6,829 was matched on Betfair around three hours before kick off; £503 waiting for backing the home win and £89 for laying it.

In contrast, Smarkets showed £246 waiting for backing the home team and £138 for laying. Unfortunately, there was no information on the amount already matched in Smarkets.

In Betdaq, although only £860 was matched at this time, £112 was waiting for backers and £212 for layers. You can see the odds were about the same in all three betting exchanges.

For WBX, this game was also offered but the gaps between the back and lay odds clearly indicate that liquidity levels for this match were far below its rivals.

Although less matched, this snapshot shows Smarkets with greater liquidity than either Betfair or Betdaq; there was more money waiting to be matched on the outcomes.

Essential Betting Exchange Accounts

From the liquidity perspective, Betfair is an absolute must for major leagues. Not only do they have a huge number of games on offer, but also almost every conceivable bet type, which is not the case for the other betting exchanges. Not yet.

Following closely on Betfair’s heels is Smarkets, whose liquidity is getting better all the time, not only on the big games in major leagues but, especially so in less prominent leagues. There, they may even be challenging the market leaders at the time of writing.

The lion’s share of liquidity and bets struck with exchanges is commanded by Betfair, often closely followed by Smarkets and then Betdaq, with Matchbook and WBX lower down the pecking order.

However, even if Matchbook and WBX are far smaller than the other three and have a limited range of available markets, they are competitive on the more popular bets in the larger leagues, such as the full-time 1×2 market.

Essential betting exchanges - Betfair and serious competitors:

betfairsmarketsbetdaqmatchbook

Note: Please be aware that some of the above links may not open from your location. Betting exchanges are required by law not to permit accounts to be opened by, or used from, customers based in jurisdictions where they are not licensed to operate.

Half-time Results are more Predictable than Full-time

$
0
0

It makes sense, doesn’t it? Predicting the result of a full 90-minute match has to be harder than predicting the outcome of just the first half.

Logically speaking, any full-time (FT) football betting strategy must be riskier than betting on the half-time (HT) market as there is more time for a result to go against you.

On the contrary, you can of course say there is more time for the result to go in your direction, but the old cliché, ‘It’s a game of two halves’, is never more appropriate than when looking at the stark differences between HT and FT betting.

Major Differences between HT and FT Statistics

1. Goal Distribution

Compared to FT goals totals there are naturally fewer goals in the first halves of games in every league you can possibly analyse.

The HT goals data set produces higher concentrations of correct score frequencies within a tighter range of outcomes than the FT market. Fewer goals also mean higher and tighter under/over ‘X’ goals frequencies, and indeed, every other HT goal related market.

FT scores are far less predictable due to a wider variety of actual outcomes and the significance of the FT data set is more diluted as even the most populated correct score clusters contain fewer results than the most populated HT score clusters.

Thus, a larger pool of statistics is needed for FT analyses before the cluster groups can be considered as being significantly populated.

2. HT and FT 1×2 Results

First Half Mentality:

It is a hard fact that no game can be won in the first half. For many teams the first half is all about containment and reserving energy for the more decisive second period of play.

The first halves of so many matches see teams cancelling each other – underlying fitness is more evenly matched between the teams at the beginning of a game.

It is undeniable that players are physiologically fresher at the start of the first half than they are at the beginning of the second period.

Mentality may also be affected knowing that there is always the second half in which to make up for mistakes and/or missed opportunities in the first.

Whatever the reasons for first half deadlock it is a fact that the draw is the most common HT 1×2 result in every league and in every season.

Second Half Mentality:

The second half will always be played under different circumstances to the first.

Rarely do you see teams ‘throwing the kitchen sink’ in the first half. Typically, this is a second half ploy seen towards the end of games when, if it reaps rewards, there is little time for the other team to hit back.

The bigger, richer clubs can afford better training and medical facilities, which means fitter players. Player fitness levels tend to be more of a factor the longer the game goes on.

Tactical substitutions are normally performed in the second halves of matches when fresh legs versus tiring ones can make all the difference.

Fitness can have even more of an effect on the FT outcome if a team is playing within three days of their last match (as it is medically acknowledged that players need at least three days to recover between games).

An example of this fatigue syndrome is the ‘European hangover’ seemingly suffered by teams playing midweek European competition games. No matter how large their squads are, there are always a noticeable number of below par domestic performances from these teams the following weekend.

And of course, successful teams tend to play more games per season than not so successful ones.

The most common FT 1×2 result is the home win but not in every league in every season (i.e. more volatile).

3. Favourites and Underdogs

The majority of bettors are usually driven by a desire to back the nailed-on favourites, especially when looking at less popular or more obscure leagues.

But greater value is more often found in the underdog market, predominantly so in less popular leagues where favourites tend to be perennially under-priced (appearing to be heavier favourites than they really are). In response, underdog prices are over-priced (indicating a smaller chance of winning the game than they actually have).

Underdogs tend to perform better in the first halves of games. Usually their mentality is to ‘have a go’ from the start rather than sit back and wait to be beaten by a better team on paper. They have nothing to lose.

Unfortunately for them, underdogs don’t often see the job through to the end. The FT underdog market does perform well in some leagues but often not as well as it does at HT in those same leagues.

The draw is usually the shortest priced event at HT except when overwhelming favourites play rank outsiders; the draw then becomes the second shortest price. The 0-0 draw is the most common HT result in every league and in every season.

In the FT market, the favourite is always either the home team or the away team, never the draw, although we will see from our example on the next page that the 1-1 draw is the most common FT score in almost every league.

Bet and Win – Avoid Placing Bets at the Start of Season

$
0
0

If you are not operating a football betting portfolio which is primarily aimed at diversifying risk and balancing your cash resources between different leagues, matches, and outcomes, then it is strongly advisable to hold off from any betting at the very start of a season.

The Effects of a Break

After the break between seasons there are usually many changes observed in teams. The manager may have changed; the playing staff may have shuffled; the team could even be playing in a different league, etc.

Undoubtedly, three months’ ‘holiday’ must have an effect on super-fit professional footballers – After all, even millionaires are humans!

Just reflect on yourself…

  • Are you usually in full working order when you return to work after a long break?
  • How long does it take you to get back into your routines at work?
  • How often have you experienced changes in staffing, organisational structure, etc., after you returned to work?


Unexpected Results and Deviations at the Start of Season

It does not matter which betting system or value betting approach is monitored, there are usually many matches observed at the start of a season finishing with unexpected results and not within statistical expectations.

It usually takes approximately six weeks to two months, until teams “settle” statistically and begin following averages from previous seasons.

Here is a screenshot from the Lay the Draw system explained in my article 1×2 Betting System: Analysis of HDA Data and Strategy Development – LAY THE DRAW

The image above shows a deficit at the start of the 2010-11 season, which persisted until mid October.

The other four seasons finished with profits around the 100 unit mark, but to gain this level of profit 50 bets were needed, translating to an average loss/win of between minus two and plus two units per bet.

The remaining 120 bets (from mid October to mid May) produced profits between 300 and 500 units which averages a win of between 2.5 and 4.2 units per match. This is not only more efficient but also easier on the nerves.

To bet and win consistently depends on the portfolio structure and betting strategy. Some systems may stabilise after the first six weeks, others may need six rounds of home matches, for example. Each strategy needs to be assessed individually.

Bookmaker Primary Aim – Diversify Risk and Balance the Book

It may appear that bookmakers don’t seem to worry too much about the start of a new football season. They invariably publish their odds far in advance of the games.

Indeed, how would the market react if bookies offered no bets during the first few weeks of a season?

To counter the unpredictability of results and the deviation from statistical expectations at the start of a season bookmakers ensure they offer odds which balance their books even if it is more of a juggling act than usual.

In summary, to bet and win consistently it is necessary to have a reliable portfolio, synchronised with the most advantageous betting time for optimum performance. Fluctuations within a season need to be taken into consideration.

It is crucial to construct a football betting portfolio which is large enough to diversify risk.

1×2 HDAFU Tables: Odds Toggle Function

$
0
0

All of our 1×2 HDAFU simulation tables (Home-Draw-Away-Favourite-Underdog) are based on highest bookmaker odds at the close of the ante post betting market (i.e. match kick-off time, when the market switches to ‘in-play’).

All may seem well but how do you check for certain whether you are on track using the bookmaker and/or exchange odds you have access to?

Your Odds vs. Highest Odds

For precision betting our 1×2 simulations include a powerful adjustment tool enabling you to gauge whether or not your promising system on paper is performing in line with the historical data you based it upon.

We call it the Odds Toggle mechanism.

The Odds Toggle will help determine the potential of your chosen strategy or, indicate that it is doomed to fail at the level of odds you are buying (i.e. you are not achieving high enough odds on a consistent enough basis).

How to Calculate the Odds Toggle

The example below shows the 1×2 odds toggle calculations for a single round of matches.

Click on the image below to enlarge it in a new tab:

Table showing the calculation of odds toggle figures

Table showing the calculation of odds toggle figures


Three Simple Steps to Calculate Odds Toggle Figures:

Step 1
The odds bought and the highest available in the market at the time are converted into percentages. In Excel this is a short, easy formula: =sum(1/odds) or =1/odds, with the result converted into a percentage.

Note: The three bold black positive figures in the three right-hand columns of the table above show where odds bought were higher than the eventual starting price but, overall in this example, the odds bought were mainly lower than the highest price available at kick-off (the negative differences shown in bold red).

Step 2
The percentages for the odds bought are deducted from the percentages for the highest market odds available.

Step 3
The differences are added together and then averaged to arrive at the final odds toggle figures.

Odds Monitoring is Essential for Reverse Engineering

The percentage difference between the best prices you achieve in the ante post period (with the bookmakers and exchanges in your portfolio) and the highest odds available at kick-off (in the market as a whole) can be used to ‘reverse engineer’ your simulation and view what effect the same experience would have had on the historical results.

Why is this so important?

  • If you are regularly achieving better ante post prices than the highest on offer at kick-off, your odds toggle calculations will return more positive values. This will improve the outlook and long-term viability of your chosen betting system.
  • Conversely, finding out how far adrift your odds are from the market at kick-off will determine whether it is worth continuing with a strategy or, whether to abort it and save valuable time and money.
  • In both cases, you will have precise information available to formulate the most effective staking plan and take best advantage from the situation.

Note: You should use the archived odds and results section in www.oddsportal.com as the benchmark to find the highest bookmaker odds available at kick-off. Odds are updated in real time and the final pre-match odds are usually shown just a few minutes after kick-off.

Our article about Betting Systems Concepts describes how to set-up an Oddsportal account and include their entire complement of bookmakers in your display, whilst our article on Oddsportal Archived Odds helps you get accustomed to the layout of their site.

Precision Odds Monitoring

For precision monitoring you will need to recalculate the values applicable to your strategy after each betting round.

The final odds toggle figure you use should always be the accumulated averages of all the games up to that point, which you have paper tested or bet upon. Do not include any matches which formed part of your historical analysis.

If you are serious about betting then you will want to review your performance every step of the way. An odds monitoring feature like this is a necessary ingredient of any successful betting strategy.

Without it you will have no exact comparison between the system you have spent hours calculating and your real betting results (or paper tests). And believe me, with such small accumulating margins sometimes making huge differences to final results, attention to detail at this level is absolutely essential.

Betting System Concepts For Successful Football Betting

$
0
0

Imagine a trawler boat casting its net into the depths of a vast lake. Although we know the fish are down there, ultimately, the only question that can ever be answered with any certainty is, “How many fish were caught?”

We cannot say in advance with accuracy how many fish there are to catch or, after the event, how many fish were not caught.

Puppy counting goldfish jumping into a bowl from a laptopImage: tobkatrina (Shutterstock)

The Mindset Required for Successful System Betting

System betting is similar to fishing with a net.

Whilst it is possible to say how many bets were won over the course of a full season (how many fish were caught), it is equally easy to see how many opportunities to win were missed (bets not placed; fish not caught), and how many winning opportunities there were in total (how many fish there were to catch).

With this much control over the available information we assure you that it is possible to identify, formulate, refine, test, and finally employ a successful betting system.

The ultimate goal of system betting is to create a strategy which becomes just a numbers exercise, where obtaining the highest price for the desired outcome becomes the primary objective to achieve ‘value’ and to gain maximum reward.

Betting is an Approximate Science

The equatorial circumference of the Earth is widely accepted as 40,075 km. However, the circumference from pole to pole is slightly less as the Earth is not exactly spherical.

Furthermore, if you were to bring into the equation all the geographical features in the path of the measuring tape and calculate the circumference including every peak and trough of every mountain and valley, then this would provide yet another different value. Which is the correct measurement?

Motor car producers test their vehicles and provide guarantees but occasionally they get it wrong and mass returns are ordered to rectify a common fault.

Of course, a vehicle’s longevity also depends where in the world and on which terrain it is used, how it is driven and maintained, plus a host of other immeasurable factors.

If you were to ask a vehicle manufacturer how long a particular model will last it will be impossible for him to say with any degree of accuracy although he can predict that a rough percentage of vehicles will still be on the road in one year from now, less in two-years’ time, fewer in three-years’ time, and so on.

What we are trying to say is that too many extraneous factors prevent total accuracy with any mathematical calculation and scholars of math will readily agree that theirs is not an exact science; some allowance for error has to be accepted in any equation or calculation.

Likewise, successful betting can never be 100% accurate.

It is impossible to predict for sure the outcome of any one single event but it is much easier to say, for example, that between 40 and 50% of the 380 matches in league ‘X’ will be home wins next season based on the historical trend for that league.

This is where system betting or ‘blanket betting’ becomes interesting: Is it possible to create a system to catch as many of the 40-50% home wins as possible using the fewest number of wagers?

Understanding Bookmakers and Odds

Bookmakers publish their odds sometimes weeks ahead of the events in question.

These odds are based purely on historical events and pay no attention to future weather conditions, size of the crowd, team news, the appointed match officials, or the form of both teams affected by any interim matches.

The bookmaker’s art is in juggling historical statistics and odds only.

No-one has a crystal ball and you can be assured that the bookmaker’s main objective is to balance his books, not to accurately predict the outcome of each event.

Only by thinking like a bookmaker will you be able to compete on a level playing field with him.

Successful betting is all about grasping the relationship between events which have already happened and the bet prices of similar events about to happen.

Maintaining your own database of statistics is vital to identify events which occur with enough regularity to be considered as potential candidates for a betting system.

Only by logging the outcomes of different bets together with the odds offered for them at a known time can you ever hope to calculate the possible viability of a system and begin to think about filtering the results to obtain the best reward possible.

Finding a Betting System

For example, the statistics we keep reveal that just three scorelines account for around 70% of all half-time scores. It does not matter which top-flight league you look at, the same three scores just keep repeating themselves in more or less the same quantities per league, every season.

Can you guess what these three scorelines are? (Use the comments section below).

Regular patterns such as this are ideal for planning a betting system; in fact anything you can find which happens often enough and regularly enough to warrant continual betting on the same desired outcome for consistent profits.

It goes without saying that bookmakers are not stupid and it is rare to find a result over the course of time uniformly priced in your favour.

In other words, it is difficult to find an event which will be profitable when staking or risking the same amount on the same desired outcome in every match in a league during the course of an entire season. But this does sometimes happen, we can assure you.


1X2 Betting System – Staking the Underdog

$
0
0

Every year we publish HDAFU simulation tables (Home, Draw, Away, Favourites, Underdogs), which model profit & losses for five seasons in each featured league for developing profitable betting systems.

Today’s article discusses the question what would have happened when backing the underdog playing away from home in the German Bundesliga?

Such a match was played in this league on 23/05/2015 between Moenchengladbach and Augsburg. The best bookmaker odds for the full-time 1×2 market at kick-off were: 1.57 Home; 5.00 Draw; 7.30 Away.

Moenchengladbach were the clear favourites at 1.57; Augsburg the rank outsiders. However, the men of Augsburg won the game, 1-3, defying their long odds.

How regular do such things occur? Is it profitable to bet on outsiders?

Here’s a screenshot from the ‘Backing by Odds’ tab in the simulation table for this league:

BL1 Simulation Table – Betting on Away Win 2010-11 to 2014-15German Bundesliga – ‘Backing by Odds’ tab – Five Seasons 2010-15

In the table above you can see that from a total of 306 matches during 2014-15, the away team won 79 times. (Click on the table to enlarge it in a new browser tab).

79 of 306 is 25.8%, and this percentage shows that the away team won, on average, slightly better than once every four matches.

Profit and Loss Sectors when Betting on the Away Team

Looking at the profit/loss (P/L) summaries in the ‘Totals’ column, adding together the first six rows of odds clusters produces a loss of -2,564 units, based on a flat stake of 100 units per bet.

Essentially this means if the away team was priced as a clear favourite or close to the home team’s prices, they won less frequently than the probabilities indicated by their odds. The last of these first six cluster groups closes at away odds of 2.90.

Look at the second row of the table. The odds cluster between 1.66 (implied probability 60.2%) and 2.00 (implied probability 50%) contains 83 matches and, if the odds had been ‘fair’, 55.1% (60.2% + 50% / 2) of the away teams priced in this group should have won.

As you can see, this was not the case! Of 83 games in five seasons only 43 were away wins (51.8%).

Therefore, punters who regularly backed away favourites in the Bundesliga during 2010-15 surrendered ‘value’ in their bets to the bookmakers. When this happens, only one side of the deal wins in the long-run; invariably it isn’t the bettors!

Okay, let’s take a look at the away underdogs…

BL1 Betting on Away Win - 2010-11 to 2014-15German Bundesliga – ‘Inflection Points’ tab – Five Seasons 2010-15

This screenshot shows a steep rising curve starting at odds of 4.40 and continuing until odds of 17.0.

Over five seasons, 462 matches fell into this group (Moenchengladbach vs. Augsburg being one of them). The away underdog won 88 times = 19% hit rate!

In these odds clusters the away team won, on average, once in every five matches. The average betting odds were 6.40, representing a probability of 15.6%.

The curve shows, as well as the calculations (19%/15.6% = 121.7%), that the mathematical advantage was on the side of the gambler!

The P/L curve registered 653 units profit at the start of our selected segment and finished at 13,727 units. This is a difference of 13,074 units of profit located solely within the away odds cluster group from 4.40 to 17.0.

Why does this advantage exist? How does it happen?

Backing Low Odds Favourites – Downfall of any Betting System

Most bettors prefer betting on the more popular and ‘emotionally safer’ shorter-priced favourites, but please ask yourself the following two questions:

  • How does a profit-oriented company (i.e. bookmaker) set its prices?
  • Should the prices (odds) for favourites rise or drop?

Both common sense and business acumen prevail in this situation:

Many customers = High demand = Higher ‘prices’ for the product!

The market dynamics are the following: The more bets expected to be placed on a particular outcome, the more bookmakers reduce their odds. Reducing odds mean that the bettor must risk more money (stake more) to achieve the same financial outcome. The punter therefore pays a ‘higher price’ (gets lower odds) for the same product:

Odds 2.0 → stake 50 = win 50
Odds 1.5 → stake 100 = win 50
Odds 1.25 → stake 200 = win 50

Falling odds means:

⇒ Rising stakes
⇒ Potential to lose more money
⇒ Lower percentage returns should the bet win!

Although this relationship may seem paradoxical, falling odds means rising prices!

Bookies adjust Favourite & Underdog Odds to Public Expectations

To reiterate: Falling odds for an outcome is a clear indicator that this is a favourite. Warning! Dropping odds do not indicate that the statistical probability for the favourite winning the game is improving; purely the fact that the outcome is becoming more and more favoured by bettors. This is a betting fundamental, which many gamblers are totally unaware of.

Falling odds mean bookmakers are effectively raising the price for the product! The product itself does not change in the slightest (i.e. betting on the favourite), but it becomes more expensive to buy. The bettor has to risk more money in order to win the same amount. In this case, you do not get ‘more for your money’, but considerably less!

Let’s use a different example. A confectionery company launches a new chocolate bar, which becomes an instant success. Demand increases; the company naturally takes advantage of the situation by raising the price. You can certainly make the statement that if the price of the chocolate increases it is a ‘favourite’, but the product itself never changes – it’s still a 100g chocolate bar!

The last word here is that since the books have to be ‘balanced’ (i.e. the payout of all three 1×2 bets combined needs to add up to around 100%), whilst the ‘prices’ for favourites are lowered to take advantage of the demand, on the opposite side, the odds for the underdogs rise.

1×2 Betting: 2016-17 Profit/Loss Simulation Tables

$
0
0

Buy the 4th Generation of HDAFU Tables

Soccerwidow’s Home-Draw-Away-Favourite-Underdog simulation tables are a revolutionary way of looking at a large data set to immediately see profitable 1×2 areas, enabling you to filter the results for precision betting.

The traditional home, draw, away Profit/Loss simulations are supplemented by a complete overview of the favourite and underdog markets, plus separate tables for the favourite playing at home or away and the underdog playing at home or away. The tables also include visualisations of inflection points, a very powerful tool for finding consistently profitable segments.

This unique product also breaks down results into odds clusters and odds ratios. There are more than 100 different simulations per league, providing clear guidance for what to back or lay, and what to avoid.

Winter Leagues 2011-16 – FULL-TIME (FT) – Excel.XLSX:

Summer Leagues 2011-15 – FULL-TIME (FT) – Excel.XLSX:

Buy Now!

PRICE: £ 24.90 PER HDAFU SIMULATION TABLE

Prices are net prices ex VAT (Value Added Tax).
VAT will be added on the checkout page according to your country location.

Soccerwidow Ltd is obliged, in accordance with applicable law, to charge VAT
on sales of digital products and services to customers within the European Union (EU).
Read more: EU VAT Information

The following discounts apply for multiple purchases:
Buy 3 tables = 15% Discount (coupon code: HDA15)
Buy 5 tables = 20% Discount (coupon code: HDA20)
Buy 6 or more tables = 25% Discount (coupon code: HDA25)

Please contact us (sales[at]soccerwidow[dot]com) should you have any questions regarding checkout and payment. For further clarification about the HDAFU tables please use the comment function below.

Should any of the above codes not work for any reason (It’s Javascript and some browsers may prevent the lightbox opening) please use the basic version of the cart to purchase your HDAFU Simulation Tables

The tables for sale are in Excel .XLSX format. Should you require a different format,
please feel free to get in touch with us by email.


Screenshots from the EPL HDA Simulation Table


The Power of the Home, Draw, Away, Favourite and Underdog Simulation Tables

Each table contains the following Profit/Loss simulations for backing Home wins, Draws, Away wins, Favourite and Underdog betting:

  • from an Individual Team perspective (when playing at home or, playing away)
  • by Odds Clusters (home odds, draw odds, away odds)
  • by carefully selected Odds Ratios (favourites or underdogs at home or away, similarly matched teams, etc.)
  • by Inflection Point Graphs for home, draw, away, favourite and underdog odds

Individual teams or odds clusters, which have been traditionally, intentionally, or accidentally over- or under-priced by the bookmakers will become evident and you will definitely notice patterns and opportunities for adding selections to your existing betting portfolio or when creating a new betting system.

Each workbook is interactive allowing you to insert your own Staking Levels. Tailoring further for individual needs, the tables include an Odds Toggle option for each bet type.

There are also Commission Rate Toggles allowing you to enter the level charged by your favoured betting exchange or broker.

>>> buy your hdafu tables <<<


Frequently Asked Questions

Is there a time restriction on the usefulness of the HDAFU tables?

The tables simulate the profits and losses by betting type for the last five complete seasons if choosing the same bet type for every game of the season. Therefore, the ‘natural’ cut-off point is the end of the following season when the tables have to be re-calibrated.

Simulating the profit/losses when betting on the same outcome over the last five seasons, the tables show a picture of the likely (expected) distribution for the forthcoming season.

If the bettor chooses a distribution which is equally spread over the year (e.g. away underdogs in the German Bundesliga with odds between 4.0 and 17.0), then it doesn’t really matter when the systematic betting starts.

The HDAFU tables are a great help at any time throughout the season to provide focus upon profitable areas within your chosen league and allow you to refine your final bet selections.

Further reading:
Probability, Expectation, Hit Rate, Value, Mathematical Advantage: Explained
Avoid Placing Bets at the Start of Season

What is the relationship between the HDAFU tables and the Value Bet Detector?

The HDAFU tables simulate profit/losses when betting systematically on one specific outcome, e.g. backing the favourite playing away. The Value Bet Detector is an odds and probability calculation tool for particular matches of interest.

Both tools originate from the time when I (Soccerwidow) wrote match previews for Betfair and needed to identify games containing value bets so that I could analyse them and publish profitable picks.

The HDAFU tables were developed as a tool to recognise clusters of matches that were far more likely to contain value bets, and thus provide me with filtered sets of matches to preview.

I often receive questions such as, “Can the HDAFU tables and the Value Calculator support each other?” or, “What is the relevance of the HDAFU tables?” or, “Which methodology is better?”

Ultimately, both products are tools for odds calculation and understanding the betting market. The Value Bet detector is an analysis tool for individual matches, the HDAFU simulation tables can also be used for systematic betting in larger numbers.

Further reading:
How do Bookmakers Tick? How & Why do they Set Their Odds as they do?
How Bookmakers’ Odds Match Public Opinion

How to structure a portfolio and what is the best size for it?

“A portfolio is a package of bets where extensive analysis has determined the choices (picks)… This is an essential part of the whole betting strategy in order to reduce the risks of losing by diversifying.”

Now focus on the main expressions: extensive analysis… determined choices… whole betting strategy… reduce risks… and lastly… diversifying.

Actually, there is nothing more to say. Just spend some quality thinking time on it.

It totally depends on personal preferences, on the availability of betting markets to you, on your risk awareness, your understanding of probabilities and statistics, and finally using all of this combined knowledge to make your best personal judgement, never losing sight of the fact that the bottom line is making profits.

Further reading:
Calculating Odds for League Newcomers is Unpredictable
1×2 Football Betting – How to Compile a Winning Portfolio

Are the HDAFU tables for both, back betting and lay betting?

Yes. Although the HDAFU tables directly simulate what happened from a backing perspective over the last five seasons, they are obviously reversible and provide a sound benchmark for formulating lay betting strategies.

Large positive figures and rising curves within the tables indicate promising back betting opportunities, whilst large negative falling curves point to potential lay strategies.

The HDAFU tables come with an odds toggle as well as an exchange commission toggle so that the user can adjust the base figures where necessary – This is of great importance to those wishing to accurately analyse lay strategies.

Don’t forget that betting exchange odds are often ‘higher’ than the highest bookmaker odds and, of course, have a built-in commission surcharge levied by the exchange platform. The effects of these variables can be gauged using the toggle functions within each HDAFU table.

Further reading:
1×2 Betting System: Analysis of HDA Data and Strategy Development – LAY THE DRAW
1X2 Betting System – Staking the Underdog

Why is concentrating on bet types more profitable than betting on teams?

The answer to this question is simple psychology, which often defeats the average punter.

There are millions of people who follow one or another team. They read all the news available, discuss form, players and managers, and everything else there is to think about when a match involving “their” team is coming up.

There are plenty of “must win” situations, and even if the odds seem a little short, bets are still placed on the team they support to win the game. Both reliance on luck and a lot of hope goes into each game.

Unfortunately, gut feelings are a very wrong adviser and team news also has no relevance to the ‘true odds’ of a game; little wonder that there are more losing punters than winners.

The HDAFU tables help the gambler to disconnect all emotions from betting. The figures show very plainly where to concentrate when compiling a betting system portfolio for profit.

Perhaps you will prefer certain bet types, or betting within certain odds clusters, or even concentrating on away teams when the match is equally matched – the HDAFU tables reveal all this and more.

Perhaps you wish to concentrate on draws when the home, draw, or away odds (or a combination of them all) meet certain conditions? Again, the tables are sophisticated and refined enough to provide you with such detailed information.

Further reading:
Finding Betting Odds Inflection Points
Half-time Results are more Predictable than Full-time

What do you recommend to read for better understanding of the HDAFU tables?

HDAFU Tables Knowledge Base

1X2 Betting System – Staking the Underdog
How to Compile a Winning Portfolio
Finding Betting Odds Inflection Points
Odds Toggle Function


HDA Betting: Profit/Loss Simulation Tables
PRODUCT SUMMARY

  • Format: Excel .XLSX (compatible with Excel 2007 and higher, LibreOffice, Google Sheets, OpenOffice, etc.)
  • File Size: between 1MB and 3MB each
  • Publisher: Soccerwidow Ltd; 4th revised edition
  • Simulations within each Workbook: over 100
  • Language: ENGLISH

By purchasing this product you agree to our Terms and Conditions and Privacy Policy.

After payment you will be redirected to download your purchased product(s). You will also receive an e-mail with a confirmation of your purchase and download link from DPD (our partner for storing and delivering of digital products) as well as from PayPal (our partner for secure payment processing).

PayPal is an online payment service that is world-wide used for processing secure payments on the Internet. Paypal supports all major payment methods such as direct debit, credit cards and deposits. Should you wish another payment option then we also offer Neteller, Skrill (Moneybookers) or bank transfer. Check here.


Customer Comment

I have recently purchased some HDA tables which I have to say are simply excellent.
They have certainly opened my eyes to areas I had never considered before.

Studying them fully will take me a while but I used some insights gained from them on a few
games at the weekend and again, I have to say that I am very impressed with the product.

Hector

>>> buy your hdafu tables <<<

Customers Who Bought This Item Also Bought:

How we made £10k in 178 days with the Summer League HDAFU Tables

$
0
0

They say that the proof of the pudding is always in the eating.

Here is the story of how we made over £10,000 in 178 match days from £100 level stakes during 2016 with a straightforward series of backing systems made up of a portfolio of nine leagues from our Summer League HDAFU tables. (14 leagues for 2017 now available for sale).

FREE Download!
2016 Summer League Campaign Workbook

Full details of our 2016 Summer League portfolio are included in a dedicated Excel workbook, which you can download here for free. This workbook details every bet placed in all nine leagues, together with a chronological summary, the winning and losing streaks, and the parameters of each system employed. It’s a must-have simply as a monitoring sheet template, and you will need it to understand much of what we talk about below.

Click on the following link to receive your free download via email:

>>> 2016 summer league campaign <<<


Just click on the button above and then on “Continue Checkout” in the pop-up box. Enter your name and e-mail address and our store will then deliver the file to you via e-mail, free of charge. The size of the Excel file is 278KB. (Warning: Please do not apply these systems to future seasons – the parameters will certainly have changed, with each league requiring a complete re-analysis).

Overview of the Monitoring Workbook

1) Summary Tab

Here you will see the 15 separate systems we decided to play with; a well-balanced mixture of backing home wins and favourites (six systems: low risk/low return) and away wins and underdogs (nine systems: higher risk/higher return).

At the time of analysis, although there were viable systems for the draw apparent, other systems took preference. (However, we do employ several draw systems in our Winter League portfolio).

You will also see that in certain leagues, we ran different systems in the first and second halves of their seasons. In other leagues, the system chosen was a better fit for the whole of the season (U.S.A., Finland and Japan).

Analysing our HDAFU tables is now a much faster exercise than ever before despite the fact that each league now comes with three separate workbooks: one to demonstrate the five full seasons approach; one limited to games in the first half of each season; one limited to games in the second half of each season.

As frequently happens, there is more than one opportunity to analyse in each of the three workbooks, but we take only the most promising system per league, or two if the league is split into half seasons. Read more about this approach here.

Running more than one system per league in the same market (in this case, the 1×2 market) causes confusion with conflicting betting decisions. It also means relying on something that is not the most promising in that league to help support the portfolio as a whole. With portfolio betting it is essential to field the strongest team from the start without involving any also-rans.

If we were to start mixing the best performing systems with lesser ones then we would be mixing apples with pears. The sweet tasting apple pie we hoped to bake would be contaminated. Always better to compare and match apples with apples.

On the whole, the time taken to analyse and then decide upon which system to support was no more than a couple of hours per league, sometimes a little more, sometimes less.

For the nine leagues represented, we spent less than 20 hours coming up with the 15 systems.

i) Expectations Prior to 2016 Season

In columns F-P, you will see a complete breakdown of the figures our 15 systems forecasted for the 2016 season in each league.

You will also see a box entitled Possible Yield Range (Row 30). We have highlighted the Average Yield and Lowest Yield expected, which you will see is between 23.86% and 1.58%. This is the more realistic threshold we expected our final result to occupy.

The Highest Yield expected of 46.05% is an arbitrary figure. It is virtually impossible to achieve for the following reasons:

  • It represents a cherry-picking exercise because the 46.05% figure is a synthesis of each league’s single highest profit season from the five analysed. Which season is the ‘best’ is also unlikely to be the same one in different leagues. For example, it might be the 2015 season in Japan and 2016 in Sweden.

    Although there is a tiny possibility that all nine of our leagues simultaneously experience their best season in the last six in the bet types we are targeting, the statistical chance is negligible.

  • The HDAFU tables are based on highest market odds at the close of the ante post market and it is extremely unlikely that you will obtain the highest odds available with every bet you place. The more realistic expectation is therefore always going to be less than the Highest Yield forecast.
  • Some of our 15 systems were bound to fail although guessing which ones would was impossible to answer. We knew this before we even started. There are several reasons for this:
  1. We chose systems which showed a historical profit in at least four of the five seasons analysed. Even with a system based on five seasons’ profit, there would still be chance of it failing in the sixth season.
  2. The league may experience a lower than average hit-rate in the new season. In fact, the coming season may be an anomalous one altogether. For example, it records the worst hit-rate for home wins in the last 10 seasons. Without the need for a complicated mathematical calculation we can say right away that there is a basic one in 10 chance of this occurring, and 10% is 10%, not zero.

    The more leagues and systems used, the more times this chance is faced and 10-year record highs and lows have to be set sometime. Of course, if we narrow things down and say that the league records its worst set of home wins in the next season (the sixth: the one after our five seasons’ analysis), the chance of the new season being the worst of the last six is a basic one in six (16.67%).

    Likewise, for a bet type to record its best results for 10 seasons, the chance is again 10%, and 16.67% in the last six seasons.

    Of course, the reality of the overall performance is likely to be somewhere in the middle (a standard distribution bell curve). Not all systems will fail and not all will over-achieve but by picking the sweet spots in the historical results, our chances of overall success are enhanced.

  3. Bookmaker odds across the board may be slightly lower than usual. We have definitely seen evidence in the data we have collected over the years that there are some seasons where the odds setting for a particular bet type is markedly different from previous seasons. It’s not often, but it does happen. It may not influence whether you make a profit, but it will affect the size of it.
  4. Next Page: Season Results and Post-Mortem

2017 Summer League HDAFU Tables – For Sale!

$
0
0

The 5th Generation of HDAFU Tables is Here!

We had a breakthrough in our thinking last year so we experimented with the idea. It was one of the reasons we published so few articles in 2016.

Knowing from experience that the first and second halves of a football match are usually played in very different circumstances, we extended the idea to leagues as a whole.

Analysing a season’s results (or a set of them together) naturally gives only a blend of what has happened during the whole season. Splitting the analysis into halves makes far more sense. After all, so many leagues have winter breaks, or mid season intervals, and many of those leagues without a recognised break have a natural break in their programmes. The break is so long in certain leagues (e.g. Russia) that their season might just as well be two separate seasons.

We therefore decided to split the HDAFU tables (Home-Draw-Away-Favourites-Underdogs) into three separate tables per league. One showing the five season whole season picture, the next showing the first half season results (before the break), and the last showing the second half season results (after the break).

The results were staggering and showed quite clearly the distinctive trends of each half season as opposed to the whole season blend. We decided to put our theory to the test and embarked on what turned out to be a hugely successful betting campaign.

Buy Your Tables Here!

Open the scroll down list and click a league to highlight it.
Click on the Add to Cart button to include the item in your shopping basket.
When you are ready to checkout, add your discount code (coupon code) if applicable (see multiple purchase discounts below), and click on Update Cart to register your discount.
Enter your personal details before clicking Continue Checkout at the bottom of the window.
You will then be given a choice of paying with PayPal or your credit card (via Stripe).
Contact us if you wish to pay via Skrill, Neteller or bank transfer.
Upon payment, download links for the files you have purchased will be automatically sent to your email address.

Summer Leagues 2012-16 – FULL-TIME (FT) – Excel.XLSX:

Buy Now!

PRICE: £33.00 GBP Per League

Prices are net prices ex VAT (Value Added Tax).
EU VAT rates will be added on the checkout page according to your location if in Europe.
If you would like to avoid EU VAT, please read the note below this box.

Soccerwidow Ltd is obliged, in accordance with applicable law, to charge VAT
on sales of digital products and services to customers within the European Union (EU).
Read more: EU VAT Information

The following discounts apply for multiple purchases:
Buy 5 leagues = 20% Discount (five for the price of four) (coupon code: SW20)
Buy 10 leagues = 30% Discount (10 for the price of seven) (coupon code: SW30)
Buy 11 or more leagues = 35% Discount (coupon code: SW35)

Please contact us (sales[at]soccerwidow[dot]com) should you have any questions regarding checkout and payment. For further clarification about the HDAFU tables please use the comment function below.

Should any of the above codes not work for any reason (It’s Javascript and some browsers may prevent the lightbox opening) please use the basic version of the cart to purchase your HDAFU Simulation Tables

The tables for sale are in Excel .XLSX format. Should you require a different format,
please feel free to get in touch with us by email.

What You Now Get for Your Money

Instead of the usual one HDAFU table per league, you now get three.

However, the price per league is still sensible at £33.00 each. (Effectively £11.00 per table as opposed to the old style tables at £24.90 each).

The new style tables presented here are also optimised for filtering.

Our recommendation is for a set of systems in several leagues, enough to provide you with a portfolio of at least 500 bets in a season. You’ll then have a chance of emulating our 2016 campaign.

How to Avoid EU VAT:

We are only obliged by law to charge EU VAT if you buy our digital products via our online platform (i.e. through this website).

If you are in Europe and you would like to avoid EU VAT, we can handle your purchase manually. Email us (in English, Spanish, German, French, or Russian) at this email address stating which products you would like to buy and how you would like to pay for them. For manual transactions we accept PayPal, Skrill, Neteller, and bank transfer (EFT).

If you wish to pay by credit card, then the only current method is via the online platform where VAT will be charged.

How we made £20k in 214 days with the Winter League HDAFU Tables

$
0
0

Following up the successful 2016 Summer League Campaign, here is our complete report on the 2016-17 Winter League Campaign, based on 18 different top flight leagues.

We will try to avoid repeating what was said in the summer league article so that it is all new information for you here, but for the sake of completeness, you should still read and digest both reports for a full idea of our strategies and thought processes.

And you will find the current stock of available HDAFU tables via this link.

Sadly, the length of time it has taken us to put together this article and the accompanying spreadsheet means that we are not able to offer it for free.

Indeed, the information contained in the following spreadsheet is far, far more extensive than the Summer League free download, and is a betting education in itself.

And we are sure that you will feel the nominal £6 charge is worth every penny: It will double as an ideal template for your own portfolio structuring and monitoring processes.

The size of this .XLSX Excel file is 553KB:

>>> 2016-17 winter league campaign <<<


Features:

  • The spreadsheet details every bet in every system used and is totally customizable, including a stake toggle (Chrono tab cell N1838) to allow you to see the effects of different levels of flat staking.
  • Includes a separate tab for each of the 22 systems used, detailing the systems themselves and the individual bet results.
  • The Chrono tab brings the 22 systems together in one tab for collective detailed analysis.
  • The Inflection Points graph tab shows the profit curve’s adventures based on the full range of odds bought. (This is a static table relevant only to this portfolio).
  • The most important addition is the Stake Ratchet and Stop-loss simulation (an example of a medium-aggressive progressive staking plan: Chrono tab), which will provide you with the ideas and tools to manage your money professionally and make it work at optimum levels in order to maximise profits.


2016-17 Campaign Report

Measures of Risk

Before beginning to plan any portfolio or placing bets, you will need to review your analyses and rank the systems you have found according to risk exposure based on the values of the upper inflection point odds.

This will allow you to compile a portfolio with a healthy balance of risk, which is essential to the success of any investment plan.

Here is our rough guide:

  • Low Risk (Probability 45.00% or more; upper inflection point maximum odds of 2.22)
  • Low-medium Risk (Probability 44.99%-35.00%; upper inflection point maximum odds of 2.85)
  • Medium Risk (Probability 34.99%-22.50%; upper inflection point maximum odds of 4.44)
  • Medium-high Risk (Probability 22.99%-16.00%; upper inflection point maximum odds of 6.25)
  • High Risk (Probability 15.99% or less; upper inflection point odds above 6.25)

Discretion is used if a system does not fit these parameters or crosses two or more classifications.

Measures of Success

You will also need a definitive framework to be able to judge the final results.

For us, the final results of any league fall into four distinct categories:

  • Systems that achieve a six-season-high (i.e. profits larger than any of the previous five seasons). (Over-Achievers).
  • Those that make a profit over and above the size of the initial stake (£100 in our case), but fall short of six-season-high results. (Achievers).
  • Strategies that break-even or, record a tiny profit or loss up to the size of the initial stake (£100 in our case). (Zero-Sum).
  • Leagues that make a loss over and above the size of the initial stake. (Losers).

You can already see that two of these outcomes are favourable, one is neutral, and only one is detrimental.

2017-18 Summer and Winter League Calendar

$
0
0
Whilst some leagues have still not confirmed their schedules for 2017-18*, here is our guide to the start/finish dates and mid-season breaks of all leagues represented in our HDAFU Table portfolio.

*Updates will be performed when information becomes available.

We begin with the more popular Winter Leagues; the Summer Leagues are detailed on Page 2.

2017-18 Winter Leagues

01. Australia A-League

As the A-League has no recognisable mid-season break, and the programme is so short (currently 135 matches per season), just the Whole Season Analysis is offered (single HDAFU table only).

Start Date: Typically the first or second week in October

Finish Date: Variable – The last five seasons have all differed – anywhere between the last week in March to the last week in April.

02. Austria Bundsliga

The Austrian Bundesliga has an official winter break every season (approximately six weeks) beginning in mid-December.

Start Date: 22nd July, 2017

1st Half Ends: 16th December, 2017

2nd Half Starts: 3rd February, 2018

Finish Date: 20th May, 2018

03. Belgium Jupiler League

The Jupiler League has a three/four week break beginning after the last round of matches in December each year.

The second half of the season is shorter than the first and for the sake of the HDAFU tables, finishes with the last round of matches before the league splits into Championship* and Europa League Play-off* groups.

(*These latter matches are not included in our analyses and should not form part of any HDAFU portfolio strategy).

Start Date: 28th July, 2017

1st Half Ends: Last week of December, 2017

2nd Half Starts: 18th January, 2018

Finish Date: 9th March, 2018

04. Croatia 1. HNL

The Croatian 1. HNL has an official winter break every season (approximately seven/eight weeks) beginning in mid-December.

Start Date: 14th July, 2017

1st Half Ends: 16th December, 2017

2nd Half Starts: 10th February, 2018

Finish Date: 19th May, 2018

05. Czech Republic 1. Liga

The Czech 1. Liga has an official winter break every season (approximately seven/eight weeks) beginning during the first week of December.

Start Date: 28th July, 2017

1st Half Ends: 1st December, 2017

2nd Half Starts: 16th February, 2018

Finish Date: 25th May, 2018

06. Denmark Superligaen

The Superligaen has a seven/eight week break beginning after the last round of matches in December each year.

The second half of the season splits into a Championship Group, a Relegation Group* and includes Europa League play-off games*.

(*The Relegation Group and Europa League play-off games are not included in our analyses and should not form part of any HDAFU portfolio strategy).

Start Date: 14th July, 2017

1st Half Ends: 9th December, 2017

2nd Half Starts: 10th February, 2018

Finish Date: Late May, 2018

07. England Premier League

The Premier League has no mid-season or winter break, but the season breaks naturally at the end of the calendar year.

Start Date: 11th August, 2017

1st Half Ends: 30th December, 2017 (Round 19)

2nd Half Starts: 1st January, 2018 (Round 20)

Finish Date: 13th May, 2018

08. France Ligue 1

Ligue 1 breaks for around three weeks just before Christmas each year.

Start Date: 4th August, 2017

1st Half Ends: 20th December, 2017

2nd Half Starts: 13th January, 2018

Finish Date: 19th May, 2018

09. France Ligue 2

Ligue 2 breaks for around four weeks just before Christmas each year.

Start Date: 28th July, 2017

1st Half Ends: 15th December, 2017

2nd Half Starts: 12th January, 2018

Finish Date: 11th May, 2018

10. Germany Bundesliga

The Bundesliga has a break of four/five weeks each year beginning in mid-December.

Start Date: 18th August, 2017

1st Half Ends: 16th December, 2017

2nd Half Starts: 20th January, 2018

Finish Date: 12th May, 2018

11. Greece Super League

The Super League has a break of around three weeks usually beginning during the third week of December.

Start Date: Second/Third week of August, 2017

1st Half Ends: Third week of December, 2017

2nd Half Starts: First week of January, 2018

Finish Date: Variable – The last five seasons have all differed – anywhere between mid-April and the second week in May.

12. Italy Serie A

Serie A has a break of around two weeks beginning after the last round of games immediately before Christmas, with the re-start during the first or second week of January each year.

Start Date: 19th August, 2017

1st Half Ends: around 23rd December, 2017

2nd Half Starts: around 6th January, 2018

Finish Date: 20th May, 2018

13. Netherlands Eredivisie

The Eredivisie has a four week break beginning after the last round of games immediately before Christmas.

Start Date: 11th August, 2017

1st Half Ends: 24th December, 2017

2nd Half Starts: 19th January, 2018

Finish Date: 6th May, 2018

14. Poland Ekstraklasa

The Ekstraklasa has a seven/eight week break beginning after the last round of matches in mid-December each year.

The second half of the season splits into a Championship and Relegation Group, and all matches are included in our analyses for inclusion in any strategy.

Start Date: 14th July, 2017

1st Half Ends: around 15th December, 2017

2nd Half Starts: 9th February, 2018

Finish Date: end of May/beginning of June, 2018

15. Portugal Primeira Liga

The Primeira Liga has a two week break beginning after the last round of matches immediately before Christmas each year.

Start Date: around Second/Third week of August, 2017

1st Half Ends: around 22nd December, 2017

2nd Half Starts: First/Second week of January, 2018

Finish Date: Variable – The last five seasons have all differed – anywhere between the second and fourth week in May.

16. Russia Premier League

The Russian Premier League needs an extended break to cope with the winter weather. The break usually begins in mid-December, with the re-start not until early March each year.

Start Date: 15th July, 2017

1st Half Ends: 10th December, 2017

2nd Half Starts: 4th March, 2018

Finish Date: 13th May, 2018

17. Scotland Premiership

The Premiership breaks for around three weeks each season after the last round of matches in the calendar year.

Start Date: 5th August, 2017

1st Half Ends: 30th December, 2017

2nd Half Starts: 24th January, 2018

Finish Date: Variable – The last five seasons have all differed – anywhere between the second and fourth week in May.

18. Spain La Liga Primera

La Liga Primera has a break of up to two weeks after the games immediately before Christmas.

Start Date: 11th August, 2017

1st Half Ends: With the round of matches immediately before Christmas (Round 16 or 17).

2nd Half Starts: With the round of matches immediately after Christmas.

Finish Date: 13th May, 2018

19. Switzerland Super League

The Super League breaks for six/seven weeks in mid-December each year.

Start Date: 22nd July, 2017

1st Half Ends: 15th December, 2017

2nd Half Starts: 2nd February, 2018

Finish Date: 18th May, 2018

20. Turkey Süper Lig

The Süper Lig breaks for around two weeks at the end of each calendar year.

Start Date: Second/Third week of August, 2017

1st Half Ends: Last week of December, 2017

2nd Half Starts: Second/Third week of January, 2018

Finish Date: Variable – The last five seasons have all differed – anywhere between the third week in May and the first week in June.

Understanding the Settings in Oddsportal

$
0
0

The only free source of historical, time-stamped odds available for a range of sports (not just soccer), comes courtesy of www.oddsportal.com.

From a football perspective, although we personally limit ourselves to analysing only the previous five seasons’ data with the Soccerwidow HDAFU Tables, or the previous 10 calendar years’ match results with the Soccerwidow Value Calculator, data on Oddsportal is in fact available for the last 20 seasons or more in leagues with enough popularity and longevity, such as the English Premier League.

Registering with Oddsportal

Signing-up is simple and places no obligation on you whatsoever. Our own account was set up many years ago and in all that time we have received no emails of any kind from Oddsportal, its partners, or any associated spam, a rarity following sign-ups of any nature these days.

Oddsportal’s priority is to achieve sign-ups via their site to the bookmakers they feature in order to earn affiliate commission from those customers. You don’t have to sign-up with any bookmakers, but you can continue to use all of Oddsportal’s features as a registered member.

However, if you choose not to register for an account, you will be restricted to seeing and exploring the odds of just a small selection (usually 14-16 in number) of the 80+ bookmakers Oddsportal features at any one time.

As an aside, Soccerwidow is not affiliated in any way with Oddsportal but owing to their importance in the grand scheme of things, we are always happy to recommend them.

Oddsportal Settings

Once you have registered and signed-in to your account, you will need to customise your Oddsportal layout. In the top right hand corner of the home page you will see the settings button illustrated with a small cog symbol ⚙ (next to the “logout” button).

You will then see the various settings options. Here is a screenshot showing Soccerwidow’s settings, which we use to facilitate our own data scraping and odds checking:

Oddsportal Settings ScreenshotOddsportal Settings Screenshot

Notes:

  • The “Primary Type of Odds” setting refers to what you see when you open any individual game. If you choose the AH (Asian Handicap) O/U (Over/Under), or any of the other options, then that bet type tab will be the first you see. However, it will always be the 1X2 odds displayed when initially opening a league.
  • It is usually quicker to see which bookmaker is offering the best odds if you “Sort bookmakers by” bookmaker payout. The bookmaker list of the matches you open will then appear roughly in descending odds order. The highest 1X2 odds time-stamped most recently will usually be in the top half of the list. (But of course, usually no one bookmaker will be offering best price on all three outcomes, so you will have to hunt for them). Here’s a quick example of bookmaker payout order:

Oddsportal Bookmaker Payout Order ScreenshotOddsportal Bookmaker Payout Order Screenshot

Next Page: My Bookmakers Tab; Problem Bookmakers; Manage My Leagues


Frequently Asked Questions – Make the Most of Your HDAFU Tables

$
0
0

Here are the most frequently asked support questions from our customers about using the HDAFU Tables for 1X2, favourite and underdog betting.

Below you will find many answers about utilising them to the maximum of their powers to help you develop your own successful 1X2 betting system.

If you can’t find an answer to your particular question, please feel free to ask us directly using the comments section at the bottom of this page. We usually reply within 24 hours.

These FAQs are primarily for HDAFU Table owners. The questions refer to 1X2 System Betting in connection with our HDAFU Tables.

For beginners looking for a taste of the HDAFU Tables before buying or with questions such as how to check-out in the online store, then please refer to our Frequently Asked Questions – HDAFU Tables – PRE SALES.

Click on the arrows to reveal the answers.

Popular Questions

Is there a time restriction on the usefulness of the HDAFU tables?

The tables simulate the profits and losses by betting type for the last five complete seasons if choosing the same bet type for every game of the season. Therefore, the ‘natural’ cut-off point is the end of the following season when the tables have to be re-calibrated.

Simulating the profit/losses when betting on the same outcome over the last five seasons, the tables show a picture of the likely (expected) distribution for the forthcoming season.

If the bettor chooses a distribution which is equally spread over the year (e.g. underdogs in the German Bundesliga with odds between 4.0 and 17.0), then it doesn’t really matter when the systematic betting starts.

The HDAFU tables are a great help at any time throughout the season to provide focus upon profitable areas within your chosen league and allow you to refine your final bet selections.

Further reading:
Probability, Expectation, Hit Rate, Value, Mathematical Advantage: Explained
Avoid Placing Bets at the Start of Season

What is the relationship between the HDAFU tables and the Value Bet Detector?

The HDAFU tables simulate profit/losses when betting systematically on one specific bet type, e.g. backing the home win, the draw, the away win, the favourite or the underdog. The Value Bet Detector is an odds and probability calculation tool for individual/particular matches of interest.

Both tools originate from the time Soccerwidow wrote match previews for Betfair and needed to identify games containing value bets for analysis. Here is a summary of those predictions.

The HDAFU tables were initially developed as a tool to recognise clusters of matches that were far more likely to contain value bets, and thus provide filtered sets of matches to preview.

We often receive questions such as, “Can the HDAFU tables and the Value Calculator support each other?” or, “What is the relevance of the HDAFU tables?” or, “Which methodology is better?”

Ultimately, both products are tools for odds calculation and understanding the betting market. The Value Bet detector is an analysis tool for individual matches; the HDAFU simulation tables is better for systematic betting in larger numbers.

The main purposes of the HDAFU tables is to identify value in bets in the long run. If you have doubts about a system or you like more accuracy, then you can use the Value Calculator to test out individual bets in your portfolio which have already been selected on the basis of the HDAFU tables. If a bet has value, both tools will discern that the bet has value.

One tool (Value Calculator) is simply more precise (but laborious to use) than the other (HDAFU Tables) but they can be used in tandem to some extent in order to sharpen the edge that you get.

For example, pick all your bets using the HDAFU tables. Then, if a particular system is doing very poorly (e.g. favourites), cross-check the bets you’ve chosen with the value calculator before placing them.

Further reading:
How do Bookmakers Tick? How & Why do they Set Their Odds as they do?
How Bookmakers’ Odds Match Public Opinion

How do I structure a portfolio and what is the best size for it?

“A portfolio is a package of bets where extensive analysis has determined the choices (picks)… This is an essential part of the whole betting strategy in order to reduce the risks of losing by diversifying.”

Now focus on the main expressions: extensive analysis… determined choices… whole betting strategy… reduce risks… and lastly… diversifying.

Actually, there is nothing more to say. Just spend some quality thinking time on it.

It totally depends on personal preferences, on the availability of betting markets to you, on your risk awareness, your understanding of probabilities and statistics, and finally, using all of this combined knowledge to make your best personal judgement, never losing sight of the fact that the bottom line is making profits.

Further reading:
Calculating Odds for League Newcomers is Unpredictable
1×2 Football Betting – How to Compile a Winning Portfolio

Are the HDAFU tables for both, back betting and lay betting?

Yes. Although the HDAFU tables directly simulate what happened from a backing perspective over the last five seasons, they are obviously reversible and provide a sound benchmark for formulating lay betting strategies.

Large positive figures and rising curves within the tables indicate promising back betting opportunities, whilst large negative falling curves point to potential lay strategies.

For example, if favourites in a particular league are vastly under-priced, then you can lay them. The underdogs in that particular league will then be over-priced, which would present a back bet strategy.

However, these two strategies cannot be mixed because in effect, you would be gambling on the same outcome, i.e., the favourite not to win.

Another thing to take into consideration when deciding whether laying or backing is that laying can only be done via exchanges and they charge commission, whilst backing can be done via a huge range of bookmakers without any commission fee. Of course, this only works if you have access to the bookmakers that regularly offer the highest prices, especially for underdogs.

Quite a bit of homework will be required in that direction before you’ll be able to make informed decisions.

The HDAFU tables come with an odds toggle as well as an exchange commission toggle so that the user can adjust the base figures where necessary – This is of great importance to those wishing to accurately analyse lay strategies.

Further reading:
1×2 Betting System: Analysis of HDA Data and Strategy Development – LAY THE DRAW
1X2 Betting System – Staking the Underdog

Why is concentrating on bet types more profitable than betting on teams?

The answer to this question is simple psychology, which often defeats the average punter.

There are millions of people who follow one or another team. They read all the news available, discuss form, players and managers, and everything else there is to think about when a match involving their team is coming up.

There are plenty of “must win” situations, and even if the odds seem a little short, bets are still placed on the team they support to win the game. Both reliance on luck and a lot of hope goes into each game.

Unfortunately, gut feelings are very often a false friend and team news also has no relevance to the ‘true odds’ of a game; little wonder that there are more losing punters than winners.

The HDAFU tables help the gambler to disconnect all emotions from betting. The figures show very plainly where to concentrate when compiling a betting system portfolio for profit.

Further reading:
Finding Betting Odds Inflection Points
Half-time Results are more Predictable than Full-time

What do you recommend to read for better understanding of the HDAFU tables?

HDAFU Tables Knowledge Base

1X2 Betting System – Staking the Underdog
How to Compile a Winning Portfolio
Finding Betting Odds Inflection Points
Odds Toggle Function

How do I get support?

You can always ask any questions via the comment functions at the bottom of any article in this blog. However, please try first to find an answer to your question using the search function on the top right. There are hundreds of articles to read and knowledge to acquire from.

If you cannot find a satisfying answer to your question, then post it in the closest corresponding article on the topic. This is free of charge for you. You will receive our answer submitted directly to your inbox, with no need for continuous checking.

In addition, if you subscribe to a post which interests you, then you will also receive questions and replies other readers have posted on the same article, and of course, our replies too.

Can I e-mail you with any questions? I would like you to check if I have chosen the right portfolio.

Please understand that we cannot provide free e-mail support. There are millions of punters in this world, all working hard to find the golden egg. The low price for the tables simply doesn’t allow us to establish a support center and employ support staff.

Therefore, please first try to find an answer to your question on our website and if you can’t, then ask your questions in the comments section at the foot of the most relevant HDAFU article you can find on the Soccerwidow site. We aim to reply within 24 hours. This service is, of course, free of charge.

However, you may prefer individual coaching; this can be done via email, Skype or even in person. Should you be interested in personalised tuition then please outline exactly what you are trying to achieve and email us for a quote: sales[at]soccerwidow[dot]com. Note that we are currently based in Tenerife.

>>> 1×2 hdafu tables user guide <<<

Trouble-shooting

I tried to post a comment on your blog yesterday and today also (several times), but every time it shows some kind of error (time out).

The problem lies with the caching of the site to speed it up for visitors. Unfortunately, this means that the Captcha is occasionally also cached and therefore it shows a “time out” message if not refreshed. The solution for that error message is to click the “refresh” button: This generates a new Captcha and the troublesome ‘Time Out’ message will then disappear.

I purchased some tables but I have not received the download link for the item.

Please check your Spam folder; sometimes our automated emails from GetDPD appear there. If you can’t find it please email to support[at]soccerwidow[dot]com, and we will get it sorted.

My download link has expired. Is a reactivation possible?

The download time limit is set to two weeks from the moment you purchase. The reason being that customers have a cancellation period of 14 days with the right of a full return as long as they haven’t downloaded the product within this period.

Therefore, if you have not downloaded your product, after a period of two weeks has expired you can either apply for a refund or send an email to support[at]soccerwidow[dot]com for a link reactivation.

However, we sometimes get reports that the download link was received straight away but after opening it, a message appears stating that the download is ‘expired’. This is usually a problem associated with your browser. Please clean your cache and press the F5 button to refresh the screen.

Another request we occasionally receive is from buyers who have lost their original product or forgotten to download it, and then many months later wish to reactivate the download link. We are really sorry, but our grace period is 6 months only. After this time a fee of £10 will be charged for us to trace you in the system and manually reactivate the purchase.

I just downloaded the tables but there seems to be a problem with opening the spreadsheets. Is there a trick?

The tables are in Excel.xlsx format and can be opened without problems by all versions of Excel from 2010 onwards, plus any open source software (e.g. Open Office) capable of handling the same requirements.

>>> case study: underdog betting <<<

Questions about the Timing of Bets

I am wondering about the season split in the leagues. When does the second half start? For example, Finland league has 12 teams and they play 33 rounds; USA has their own system with play-offs; Sweden has 30 games per team, and so on…

To answer this in full we have produced a League Calendar detailing when each league starts, when each stops (for its winter break where applicable), when each league begins its 2nd half, and when each league finishes.

In addition, you will find detailed advice as to which leagues include play-offs and which don’t.

The usual rule is if a league involves all of its teams in a play-off round where every team plays an equal number of games (i.e. without knock-out rounds) then these games are included in the system. Leagues such as the M.L.S., which has a knock-out system of play-offs, finishes so far as the HDAFU Tables are concerned at the end of the final round of league games.

The analysis on the HDAFU tables is based on the best closing odds. When is the best time to place the bets? Just before the game starts and then make a bet with the bookie who offers the highest odds?

Yes, the HDAFU data set comprises the highest odds available at the close of the ante post market, just before each of the matches started.

The optimum time to place bets is therefore in the final hour before kick-off, after team news has been released.

For a detailed summary of bet placement criteria, refer to page 5 of the HDAFU Tables User Guide article.

You advise to place bets always within the last hour before kick-off. How can that be done, especially when you also bet on MLS, Brazil, and Japan? Whole round of matches can be kicking off all night long, every 1 or 2 hours over there; and when the next day breaks it’s time for Europe… Is it ok to bet earlier than 1 hour before kick-off? Did you try to run an analysis what happens when you bet earlier than 1 hour before kick-off? For example, on the evening before the match?

Of course, if a match falls comfortably between your two inflection points, it will not matter how the odds move in the run up to kick-off, so many bets can be placed well in advance of the start of games.

Again, refer to page 5 of the HDAFU Tables User Guide article for more detailed advice.

For UK/ European Clients: Realistically I’m not going to be awake when the MLS matches are kicking off (and possibly not for the frequent 5am kick-offs in the J-League) and I’m wondering how essential it is that bets are placed close to kick-off? Would I be giving myself a problem placing MLS and some J-League bets before I went to bed (I’m UK based, so MLS bets would be going on 3 to 4 hours in advance of kick off, with J-League 5ams more like 8 hours)?

Please refer to page 5 of the HDAFU Tables User Guide article for more detailed advice on these situations.

Miscellaneous Questions

Would it help to add in more seasons to the analysis?

No, five seasons’ data are plenty. Any less, the population size becomes less significant. Any more, historical results become less relevant to today’s teams. Five seasons’ data are usually an optimum amount for any analysis.

Would it help to weight the seasons in any way?

With just five seasons’ data in use, it makes more sense to compare apples with apples rather than dilute the results with some form of weighting mechanism.

Ideally, it is preferable to see if there has been an anomalous season during the last five, because there is always the likelihood of repetition.

If the seasons analysed have been ‘smoothed’ by any weighting criteria it is likely that the worst case scenario will no longer be evident, or at least shown only in a watered down form.

What do you recommend as the starting bank for a cycle with £100 per bet?

This really depends upon the longest losing streak you expect to endure over the course of your campaign.

We have operated with just £2,000 as a starting bank for £100 stakes, during a season where the portfolio was almost constantly in profit. But we cannot provide recommendations as everyone’s portfolio of bets (and expected winning/losing streaks) will be different.

Do you think this would work using only an exchange – Betfair – for placing bets?

Yes, of course. But to simulate the effects of betting exchange commission on the expected results, you will need to enter a commission rate percentage at the top of each bet type in the data tab of the HDAFU Tables when carrying out your analyses. This type of system betting would also be ideal for betting bots and other automated bet placing software.

When you really start to make some money, I read on the Internet that the gambling offices limit your bets or start to do difficult. Is that true?

Yes, this is unfortunately sometimes the case, but sharp bookmakers such as Pinnacle, and betting exchanges such as Betfair, Smarkets and Matchbook, will never limit or close your accounts.

I have a tricky question: what happens if “a lot of users” start to use these methods at the same time, finding the same spots for an eventual profit? Wouldn’t these strategies start to become obsolete?

Because the choice is yours and because there are usually several different strategies to opt for in many of the leagues, it is unlikely that any two people will have exactly the same portfolios. It is also unlikely that people will be using the same stakes.

Therefore, irregular betting patterns really shouldn’t be an issue as far as the bookmakers are concerned.

Frequently Asked Questions – HDAFU Tables

$
0
0

Here are our readers’ most frequently asked pre-sales questions about the HDAFU Tables for precision 1X2, favourite and underdog betting. Enquiries such as ‘What is the use of the HDAFU Tables?’ or ‘How to buy them and check-out if I don’t have a PayPal account?’, plus many more…

If you can’t find an answer to your particular question, please feel free to ask us directly using the comments section at the bottom of this page. We usually reply within 24 hours.

These FAQ’s refer to the: HDAFU Tables.

However, if you already own HDAFU Tables then you are probably more interested in our SUPPORT FAQs, as they contain a lot of tips and tricks on utilising the tables to build a successful portfolio of bets.

Click on the arrows to reveal the answers.

Popular Questions

What are the HDAFU Tables?

HDAFU stands for Home~Draw~Away~Favourite~Underdog

The tables are powerful Excel spreadsheets presenting a retrospective analysis of the previous five seasons’ betting results, and showing the long-term effects of backing each of the home, draw, away, favourite and underdog bet types.

Unique inflection point graphs make it possible to identify the odds clusters that were/are perennially profitable.

This enables the user to select a ‘sweet spot’ in the odds range to target for betting in the following season.

Producing a whole spread of targeted bets over a number of different leagues is an ideal way of compiling a diversified betting portfolio, effectively emulating the bookmakers’ own method. 😉

Have you tried this method before producing the tables for sale and do you think someone can succeed with this method in the long-term?

Yes, and yes you can!

The HDAFU simulation tables have undergone a series of expert developments since they were first launched in 2012 following our article: Home – Draw – Away: Systematic Betting.

Today’s tables are focused on inflection point graphs to visualise profit and loss results trends, making it easy to spot the odds clusters to concentrate betting strategies upon, and also identifying those to avoid.

Here’s a video article where Soccerwidow explains Inflection Points and employing them to find a strategy for producing long-term and consistent profits.

Soccerwidow’s approach is very much an holistic one (based on the synergy of the whole rather than the performance of individual bets), which is strongly evidenced by our flagship product, The Fundamentals of Sports Betting Course explaining the art of odds calculation and the dynamics of the bookmaker market.

Understanding the bookmaker business model is key to optimising any portfolio of bets and we explain in detail how to use our HDAFU simulation tables for recognising and building profitable 1X2 betting strategies from a selection of major European leagues in our article, How to Compile a Winning Portfolio.

The HDAFU tables are a product of more than six years’ development and, for the seasoned punter wishing to progress to a more scientific and professional level, are an invaluable tool to help select what is worth betting on and what to avoid.

Go here for a range of explanatory articles full of tips and tricks to aid your understanding of the concept behind targeted 1X2 betting.

Is it really true that past statistics can be used to develop a winning strategy?

Yes, this is not only true but actually the only way to develop a winning strategy.

Strictly speaking, without knowledge of prior events, it is virtually impossible to predict with any degree of accuracy what is likely to happen in the future. Predicting something is already pretty difficult using just historical data (i.e. past experience) but without it, what else can a judgement be based on?

The whole bookmaker business model is based around statistics and the only way of ensuring a level playing field is to use statistics too.

How much do you earn based on your theories? Do you have any statistics for your betting history?

For an idea of the potential of these tables please refer to the Summer League and Winter League simulations based on £100 flat stakes. The statistics for both successful campaigns are available for download in their respective articles.

Why are you publishing these tables and don’t keep the secret to yourself?

When Elena Schaelike founded Soccerwidow back in 2011, her aim was (and still is) to teach gamblers about bookmaker maths and market dynamics to reveal how bookmakers make money and why most most gamblers don’t.

Educating gamblers to understand financial markets, training their emotions to stay in control, and teaching how to approach betting as a business and not as a casual activity are the main pillars of Soccerwidow’s ethos.

The knowledge Soccerwidow provides might well be considered within betting circles as being ‘secret’, but honestly speaking, mathematical formulas and the practical use of statistics are not classified information.

The cloak and dagger image of bookmakers is therefore a total myth: the mystery is nothing more than the more mathematically educated bookies making money from a mass of less educated punters.

Isn’t there a risk that the system will cease to work one day?

No, not really.

Firstly, the HDAFU Tables are not a ‘system’ per se, but they are a source of very useful information that each person will use differently.

Secondly, there are many different leagues, each containing several ‘sweet’ spots (different opportunities to take advantage of).

Thirdly, the tables reflect three different ‘positions’ to choose from in each league: whole of season analysis; first half of season analysis; second half of season analysis.

Lastly, there are many HDAFU Table users, each employing their own favoured strategy.

Combining these factors together means that there are countless variations possible.

Therefore, the chances of two people selecting exactly the same leagues and then selecting exactly the same systems from those leagues is highly unlikely. The chances of each then placing exactly the same set of bets at exactly the same prices is negligible.

Every individual user is different. Everyone’s attitude towards risk is different, and everyone’s tastes, preferences and choices are different.

Therefore it is safe to say that every user’s ‘system’ will be different from the next.

>>> £20k in 214 days: case study <<<

Product-Related Questions

May I ask if the HDAFU Tables are so called ‘value betting’ or ‘system betting’?

The HDAFU Tables have been developed to allow the user to develop a system. Therefore, strictly speaking, they fall into the category of ‘system betting’.

System betting is a predetermined selection of bets that, when combined, represent a profitable betting portfolio. Systems allow the gambler to have an ‘edge’ or an ‘advantage’. Of course, any system that works well contains ‘value’, otherwise it wouldn’t work at all.

System betting requires follow-through from the start to the finish of a campaign (or to a suitable closure point in profit), preferably without missing bets on any matches included in the system. For example, if the system requires the placement of 19 bets through the whole season based on a certain selection criterion (e.g. all home games of a particular EPL team), then all 19 bets really should be placed for best results!

However, ‘system betting’ must not be confused with ‘value betting’.

Value Betting is a totally different approach. A value bet is one where the ‘true’ chances of the individual bet winning are greater than the odds suggest. Identifying bets as ‘value bets’ involves comparing the market odds against own calculations. This approach relies on perennially choosing over-priced or under-priced bets to back or lay respectively.

Contrary to system betting, value betting doesn’t require follow-through from the start to the finish of a campaign but it requires calculation of each individual match to compile a portfolio of bets for each round. With system betting, once you identify your selection criteria (= system) you simply stick to it religiously.

What is the use of the inflection points?

The HDAFU Tables contain inflection points graphs and these are the most powerful tools the tables have to offer. In short, they pinpoint profitable patterns.

Inflection points are the points at which the curvature or concavity on a curve changes from plus to minus or, from minus to plus: Translated into layman’s language, the turning points on the profit/loss graph where profits turn to losses and where losses turn to profits.

In the profit zones, it is therefore possible to identify the odds at which profits start and where they end.

Bookmakers have to reduce their prices in certain odds ranges to maximise their profits. This is mainly due to a high demand from punters on certain results allowing the bookies to sell under-priced bets on a wide scale.

However, as punters expect close to 100% probability when all three bets (1X2) are summed up, bookmakers have to increase their odds on the other side of the bet.

For example, a bet that should have been priced for the favourite to win at odds of 1.50 (66.7%) is sold for 1.40 (71.3%): this is an ‘undervalued’ bet and guarantees the bookmaker a long-term profit and the punter a long-term loss.

To ‘balance’ this discrepancy out, the bet on the underdog that should normally be priced at odds of 3.50 (28.6%) is levered up to 3.75 (26.7%): as a result this bet becomes a ‘value bet’, producing a long-term profit to the gambler.

The inflection point graphs shows these turning points visually and you must remember that they are different for each bet type. Every league is also different, as is the market pressure (demand for bets) in each. For example, punters concentrating on the EPL prefer different odds clusters than those betting on the Bundesliga, and so on.

Are HDAFU tables and methods to build a system also applicable to group stage competitions, such as Libertadores, Champions League and Europa League? Or even to European or World Cup Qualifiers?

Sadly not.

It should be understood that tournament or cup betting of this nature is a hugely volatile undertaking, with teams from different leagues playing each other, or club teams or national sides that have never faced each other before suddenly thrust into competition.

Betting on domestic leagues is a far more stable environment, with a data set made up of plenty of teams having played each other on a perennial basis. System betting is far more suited to leagues than any other form of competition.

You are showing in your articles ‘League Campaigns’ complete reports for past seasons. Can you provide me with your picks for the forthcoming and/or current next season or do I need to create a portfolio myself?

Sorry, we are not a picks site and never will be. We provide all of the tools you’ll need to create your own portfolios, judge the expected returns and spread of risk, and then to select your own bets. In this way, you are in complete control of your personal campaign rather than blindly following someone else’s ‘system’.

Just wondering what would happen next season in terms of updates, do you provide instructions on how to update the tables or would I be required to buy new updated tables?

The HDAFU Tables do require updating on an annual basis. The oldest season’s data set is dropped and figures from the season just finished get added to retain a data set comprising the last five consecutive season’s results. Furthermore, we upgrade the tables each season, adding new tools and findings, with a constant eye on making them as straightforward and easy to use as possible.

If you are an Excel wizard, then you may be able to compile your own tables, but you will not find all the information and formulas we use when compiling them in any of our completed tables. (Would you even be able to tell if your own tables were providing false results?).

And of course, we know what we are doing and check everything religiously before publishing the tables for sale. We therefore recommend you buy new tables every season, or use your own at your own peril!

Lastly, when buying any products from us you contribute to the further development of Soccerwidow. Any income received is used for example, to pay writers, add well-researched explanatory articles to the website, provide customer support and reply in depth to readers’ questions.

So, are you ready to support your favorite betting advisory website? The best way to support Soccerwidow is to get involved. Tailgating us (bookmark and share with your friends), cheering if you find something useful (leave a comment) and making financial donations (purchase at least one product) are all great ways to help us spend more time helping you.

Purchase Questions

I am keen to get some tables. Could you please advise which three would be the best ones to start with?

There is no straight answer to that question because each bettor has personal preferences or limitations regarding his/her use of different bookmakers and/or choice of leagues. To decide which leagues to buy, you’ll have to do your own homework and check that your range of accessible bookmakers/exchanges is compatible with the leagues you choose.

And there really aren’t any ‘good’ or ‘bad’ choices – each league contains something of interest.

Ideally, your portfolio of bets over the course of a season should be at least 500 in number in order to obtain an effective level of diversification. Depending on the leagues you have in your portfolio of bets there will be 30 to 40 betting rounds per annum, which would require on average approximately 15 bets per round.

If the system is chosen properly you should be able to finish each round with a positive return but, in order to reach the 500 bets threshold, you will need several different leagues and we recommend a minimum of five leagues to begin with.

But the choice is yours, dependent on your time zones, access to liquidity in your chosen leagues, and even personal experiences/taste. What is sure is that you will find a selection criteria worthwhile pursuing in every league. Sometimes there are several systems to choose from in a single league.

You say that many of the smaller leagues contain the higher amount of value. Which are the best candidates to bet on?

Bookmakers and punters alike tend to analyse the most popular leagues in the most depth (those with the greatest liquidity), so that markets odds are the most accurate in leagues such as the EPL and often contain little value for the bettor.

Another big challenge with system betting is, that at some point the bookmakers will have adjusted for systems (if they recognise them, of course) to make them no longer profitable. This means that a formerly well-performing system may cease to be profitable in the future, which happens more often in popular leagues than in less popular ones.

The less popular leagues have a tendency to contain better value not because they are improperly calculated by the bookmakers, but because there is less competition between value bettors and system bettors, and therefore less reason for bookmakers to adjust their odds.

In effect, it really depends on which leagues you have access to and in which ones you would like to specialise. It’s all about diversification and we encourage you not only to focus on popular leagues like the EPL but to diversify your portfolio of bets with smaller leagues as well.

Am I committing a cardinal sin by buying tables after the seasons have started? Will that disadvantage me at all?

We have written an article on why it is a good decision to analyse each half of a season separately, and indeed, each HDAFU league for sale comes with three tables: Whole of season; 1st half of season; 2nd half of season.

Of course, buying tables before a season starts or right at its beginning provides access to systems that can be run as whole-of-season vehicles, or 1st half of season systems. But you will find plenty of systems that are lucrative in the 2nd half of a season too.

For purchasers wishing to buy tables at or after the midway point in a league’s season, although you will effectively be paying full price for half a season, our online store will automatically send you, free of charge, the full and updated (and usually upgraded) tables for the following season just as soon as they are published. This will provide you with one and-a-half seasons’ opportunities for the price of one full season.

The ideal times to begin betting are at the starts of both halves of the season, but buying a table midway through the 1st half provides plenty of time to analyse for 2nd half systems, and buying during the 2nd half of a season gives plenty of time to get used to using them.

Since all leagues are more or less half way through the season, I was wondering if you are selling only 1/3 of the spreadsheets as well? Let’s say I want to buy only 2nd half analysis of one of the summer leagues (with more or less 1/3 of the overall price), would that be possible?

Timing your purchase is not critical as we email to all clients who bought Tables in the second half of a season the updated and usually upgraded tables for the following season free of charge just as soon as they are published.

Please bear in mind that it is always helpful to see all three analyses when forming your final judgments.

>>> £10k in 178 days: case study <<<

Ordering & Delivery

Do you offer discounts?

Of course, we do!

Following discount codes apply for multiple purchases:
Buy 5, 6, 7, 8 or 9 leagues = 20% Discount (coupon code: SW20)
Buy 10 leagues = 30% Discount (coupon code: SW30)
Buy 11 or more leagues = 35% Discount (coupon code: SW35)

Please email us direct at sales[at]Soccerwidow[dot]com for quotations on all bulk order enquiries if you wish to ourchase more than 15 tables.

How can I pay for the tables? I have neither a PayPal account nor a credit card.

Details of alternative payment options can be found here: Payment Options. They include Skrill (Moneybookers), Neteller and bank transfer (EFT).

When filling out my address details in the shopping cart order form, the field ‘State/Province’ is mandatory. I cannot see states or provinces from my country.

Try pressing the F5 button to refresh your screen. Failing that, clear your cache and refresh again. If the problem persists, please contact us.

What is the price equivalence in USD?

To find out the exchange rate please follow this link to Google, which gives you the exchange rate of the day.

I live in Italy; if I understand you correctly, the purchase price for the EPL table is therefore £35.00 * 1.22 = £42.70. Is that right?

Yes, this is correct. Soccerwidow Ltd is obliged in accordance with applicable law to charge Value Added Tax (VAT) on sales of digital products and services to customers within the European Union (EU).

The VAT rate applied to these products and services is based on the location of the customer (point of sale). See the current EU VAT Rates.

Help with the Checkout

Open the scroll down list and click a league to highlight it.

Click on the Add to Cart button to include the item in your shopping basket.

Click Continue Shopping to add more items to your cart.

When you are ready to checkout, add your discount code (coupon code) if applicable (see multiple purchase discounts below), and click on Update Cart to register your discount.

Enter your personal details before clicking Continue Checkout at the bottom of the window.

You will then be given a choice of paying with PayPal or your credit card (via Stripe).

Contact us if you wish to pay via Skrill, Neteller or bank transfer.

Upon payment, download links for the files you have purchased will be automatically sent to your email address.

When will my credit card be charged?

Your credit card will be charged at the time your order is placed.

Is it safe to use my credit card on your site?

Yes, it is safe.

For processing orders we use the services of GetDPD which is a fully PCI Compliant Service Provider. During the checkout process you will be offered to choose payment by Paypal or credit card.

If you choose credit card, then the platform integrated with GetDPD is Stripe; here is their security documentation.

Can I cancel my order?

As long as you have not paid there is no order. You can always return to your shopping cart and simply delete any items you don’t wish to see in your shopping cart.

However, once you have paid you will get the product download link delivered immediately to your inbox. As long as you don’t download the product(s) you have a cancellation period of 14 days and the right of a full return. Otherwise, once downloaded, there are no returns for digital content.

If you have made a genuine mistake, it’s worth contacting us to see if you can get a refund. Normally, we will offer an exchange for another product or supply a discount code for future purchases.

How long will it take my order to arrive?

As soon as you have paid you will get the product download link delivered immediately to your inbox.

You will receive an email from GetDPD, our digital delivery partner.

Should your download link not arrive within 10 minutes after purchasing, please check your spam folder. We do sometimes receive reports from our clients that GetDPD emails land there occasionally. You can play it safe and allow within your email program emails with the endings: digitalproductdelivery.com (GetDPD) and soccerwidow.com (us).

‘Allowing’ communications from digitalproductdelivery.com and soccerwidow.com is actually quite important because we do upgrade products from time to time and you certainly don’t want to miss the free download link we will send out to buyers.

What are Inflection Points and their Use in System Betting

$
0
0

An inflection point is a point at which the curvature of a curve changes direction, that is, the curve changes from being concave (concave downward) to convex (concave upward), or vice versa.

What does this have to do with betting?

Sexy female teacher with abacusImage: FXQuadro (Shutterstock)

We speak about ‘Inflection Point graphs’ in our HDAFU Profit/Loss simulations because these graphs have turning points. Turning points are points at which a significant change occurs.

In layman’s language – Turning points are the points in the ‘inflection point graphs’ where profits turn to losses or, where losses turn to profits.

For the mathematicians under our readers, we use the term ‘turning point’ although the academically correct mathematical expression would be ‘maximum’ and ‘minimum’. However, ‘maximum’ and ‘minimum’ in normal language signifies ‘best’ and ‘worst’ but turning points in a curve have nothing to do with any judgement of being ‘good’ or ‘bad’. Sorry for any academical incorrectness in the use of the terminology, but we somehow have to make ourselves understood by everybody.


Home ~ Draw ~ Away Profit/ Loss Curves

If you have ever calculated your own odds you will certainly have noticed that bookmaker prices often do not show the ‘true’ picture.

In other words, their odds seldom adhere to mathematically calculated values (the statistically expected values).

In the majority of games, odds are either higher than mathematically expected or lower…

Is That Really True? Can You Prove That?

Here’s an image showing the Profit/Loss Curves for betting on the Home win ~ Draw ~ Away win with equal 100 units stakes over a period of five seasons; the straight red line is the bookmakers’ profit trendline:

English Premier League – Profit/Loss curves by ODDS for 2013-14 to 2017-18 seasons

What you can see in the above graph is that if one curve rises, e.g. betting on the away win if the home odds are between 1.7 and 2.15 (orange curve), then another curve falls.

In this example, betting on the draw (brown curve) produces a loss for the bettor and hence, a profit for the bookmakers.

What is most revealing in the above graph is the red curve. It shows how the bookmakers profits varies depending on the home odds, but the most interesting part is the straight line, the red trendline. It is positive for all odds and perpendicular. The interpretation of this is that for the bookmakers it doesn’t matter in which cluster a particular match is in (in the example, home odds), their odds guarantee them the same constant profit across the whole spread.

Why Is This So?

A bookmaker’s aim is to make a profit and they price their odds to ensure that sufficient action is taking place on both sides of a bet, with enough profit retained whatever the outcome.

In addition, bookmaker betting odds are often adjusted according to public opinion to guard against a disproportionately large amount of money being placed on just one side of a bet.

How can the Bettor Make Use of This Knowledge?

The bettor can take advantage of the knowledge that each betting market contains certain odds clusters that are regularly under-priced, whilst other odds clusters are habitually over-priced. But attention, please! These under- and over-priced clusters are different from league to league.

Bookmakers take into account gamblers’ preferences and these vary depending on the cultural background (e.g. risk-aversion) of the locals. This is perhaps because local bettors are the majority takers for any league bookmakers, so bookmakers take local tastes into account.

It is obvious that, for example, Italians will be betting primarily on Italian matches; Spanish people on Spanish matches, and so on.

However, please be aware that the EPL, the most prominent league in the world, naturally has a huge amount of supporters worldwide. This makes the EPL the most unreliable league (system betting-wise) in terms of its odds. Although odds patterns can be spotted easily, it is always a gamble whether or not they will be returning a profit the forthcoming year.

Nevertheless, for this article, we will use the EPL as an example.

The Significance of the Turning Points on the Inflection Point Graphs

Profit turning points can be easily spotted in the Inflection Point tabs of the HDAFU Simulation Tables using visualisations (see example below) in the form of Profit/Loss curves based on five seasons’ data within these tables.

For example, the EPL: Between 2013-18, if you had gambled unemotionally and systematically on all English Premier League matches to be away wins (at the highest bookmaker odds) and placed a constant stake of 100 units per fixture, then at the end of the fifth season, you would not have seen a large change in your bank: -125 units after 1,900 bets.

Huge losses would have been incurred, had you backed all of the away teams to win and limited your betting to the zone of odds between 2.31 and 4.53. Within this zone your losses would have totalled -9,189 units (3,714 plus 5,475).

However, if your strategy had been based on away wins at odds from 1.68 and up to 2.31, after five seasons your profit would have been 3,202 units (7,714 minus 512).

That’s quite a difference, isn’t it?

English Premier League – Profit/Loss curve for 2013-14 to 2017-18 seasons

Just as a side note… Can you see yourself betting on an EPL match targeting odds between 2.3 and 4.5 when backing the away win?

Different Leagues = Different Inflection Points Graphs

The above screenshot shows the Profit/Loss curve for the EPL if back bets on the away win were placed on all 1,900 matches between 17/08/2013 and 13/05/2018 (at 100 unit stakes).

You can see from the graph that the first turning point is located at 2.31 on the ‘away odds’ axis. At this point, the P/L curve reaches a peak of 3,714 units profit before starting to fall again. The decrease in profits continues until away odds of 4,35 are reached (P/L value: – 5,475 units), where the curve turns for a spell but remains negative until away odds of 9.5 are reached. Then it experiences a large jump before falling again.

Now, we compare this to the German Bundesliga Inflection Point graph:

German Bundesliga 1 – Profit/Loss curve for 2013-14 to 2017-18 seasons

You can see at a glance that both graphs are very different.

Whilst the EPL shows a rising curve (profits) until odds of 2.31 the Bundesliga P/L curve starts to drop straight away from odds of 1.4.

This indicates that the bettors on the Bundesliga are probably much more risk-averse than EPL bettors and it seems that they prefer betting on favourites (lower odds). Using this mentality bookmakers can reduce their odds odds in this group to optimise their profits and hence, the draw odds and/or home odds are likely to be increased.

Once you start working with inflection point graphs you will not only see the various profit /loss curves (whole season, 1st half and 2nd half) and start recognising patterns but you will be also amazed to learn about the different mentalities of bettors in different countries.

Working With the Inflection Points graphs using the HDAFU Tables

Here’s a handy little tutorial:


How to Use the Knowledge of Turning Points

(1) check your betting pattern

Do you recognise your betting patterns within the most common odds clusters; those which show a falling Profit/Loss curve? (For example, betting on odds between 2.3 and 4.5 when backing an away win in the EPL).

If so, perhaps reconsider your strategy and avoid the odds used by the bookmakers to make their profits. Of course, no matter how hard you try, betting in the zones where bookmakers habitually reduce prices (odds) is asking for long-term losses.

It is very rare for people to succeed in any walk of life by swimming against a strong current and you can safely assume that the bookmakers know their job and have for centuries been making a living from manipulating figures.

(2) don’t even try to “beat” the bookies

Swim along with them. ‘Play’ the market the same way as they do. Start looking at strategies which are not in conflict with the market, but in rhythm with it.

(3) be aware that each league has a different market behaviour

Customs and habits of people vary from country to country. Every nation has different culture or cultures. Surely everybody has noticed regional differences expressed in tangible goods such as food or housing. However, these differences extend into how people think and act.

Unfortunately, differences in betting patterns and the subsequent reaction of bookmakers when setting their odds cannot be spotted without taking a mathematical approach. Customer habits, especially in the betting market, remain well hidden from the bettor.

Whichever league you prefer betting on, identify the odds clusters which are utilised by the bookmakers to turn their profits – and then work around those clusters.

(4) use the market turning points for your own benefit

Concentrate on developing your personal betting strategy by taking the market rules into consideration.

(5) find a strategy and identify matches for producing long-term profits

Using the HDAFU simulation tables and finding the various turning points will provide you with the need knowledge of odds clusters you need to produce a long-term profit when backing.

If you already use our Value Bet Detector for calculating odds for individual matches then the knowledge of profitable odds clusters will help you to pick matches which are worthwhile re-calculating.

The Power of the 6th Generation of The HDAFU Tables

$
0
0

We are happy to announce that the 6th generation of our HDAFU tables are now ready for sale!

This is a substantial upgrade taking customer comments and queries into account such as the request of reducing human error when identifying systems, providing more assistance when judging the volatility of an identified system, speeding up the process of constructing a portfolio, providing a better feel of the expected losing sequences, and much more.

To give existing clients a comparison with the old table and new clients a good taste of what to expect, we have created a HDAFU Example Table based on the EPL 2012-17 table:

The size of this Excel .XLSX workbook is 3.4 MB

>>> free epl hdafu table download <<<


It is a fully functional table and its only limitation is that it is an expired table and cannot be used for the forthcoming season. Of course, it can be used for backtesting its functionality against the previous season (2017-18).

The test table will give you a pretty good idea of what to expect when purchasing HDAFU Tables for other leagues.

Of course, we will be populating Soccerwidow.com with updated User Guides and How To articles over the course of the next few weeks, but for those who already familiar with the filtering process, we are sure that they will very quickly pick up on the new method.

The Mightiness of the HDAFU Tables

(1) bookmaker’s business model

The bookmaker’s business model is primarily based on two factors:

Firstly, they keep a small commission on every game via overround. This is well known.

What is less known is that bookmakers when setting their odds adjust them according to the expected weight of money to be staked (= public opinion), meaning that some odds are being lowered and others are increased.

Of course, bookmakers predict (calculate) the outcomes of matches as good as they possibly can on the basis of historical statistics and whatever price adjustments (odds changes) they make are not huge and only in the region of 2 to 3% of the expected true probabilities and therefore not easy to spot.

(2) the power of the hdafu tables revealed

Due to the market expectations that the sum of the three likelihoods of home ~ draw ~ away must add up to 100% the bookmakers’ business model leads to the fact that if one side of the 1X2 bet is reduced (e.g. reducing the home win odds from ‘true’ odds of 1.65 [60.6%] to say, 1.6 [62.5%]) the other two bets in this example, the draw and away win, have to be adjusted as well (e.g. the draw odds being increased from 3.57 [28.0%] to 3.70 [27.1%] and the away odds from 8.78 [11.4%] to 9.57 [10.4%]).

Of course, another market pressure is that bookmakers tout for market share and some bookmakers will therefore offer certain bets to inflated prices (odds). To stick with the example; although the away win should be priced (according to the above ‘adjusted’ calculation) at 9.57 one bookmaker decides to offer this bet for 15.0 [6.7%]. This leads in the market to a correction of the draw odds from 3.7 to 3.24 [30.8%].

This all doesn’t mean that the true probabilities of the outcome of the match have changed. They are still 60.6% [1.65] for the home win, 28.0% [3.57] for the draw and 11.4% [8.78] for the away win but the implied probabilities now show 62.5% [1.6] for the home win, 30.8% [3.24] for the draw and 6.7% [15.0] for the away win.

Here’s where the HDAFU Inflection Point Graphs come in: They display the turning points in the odds (the previous five seasons in each league) where bookmakers habitually increase or decrease their prices.

Our HDAFU tables visualise the profit/loss curves that a bettor would have attained would he have been betting on the all the matches during a period of five seasons and with that they reveal the bookmakers best kept secret – where they ‘adjust’ their odds due to market pressures and public opinion.

With the help of the Inflection Point graphs it is very easy to visually identify the turning points and with the interactive ‘system picker’ tab to narrow down the field of view and identify profitable betting systems.

The Main Upgrades from the Previous Version

All three scenarios (whole of season, 1st half, 2nd half) are now in one file. Instead of the three HDAFU tables per league like last season you now get only one. But this doesn’t mean that you get less for your money. On the contrary, you’re getting much more!

The HDAFU Tables are in a new style Excel workbook, with everything fully automated. No more time wasted filtering and amending formulas manually, one-by-one – it’s all touch of a button stuff now.

The fully automated ‘System Picker’ tab removes the need of sorting through the data and carrying out any manual calculations. All the necessary calculations are done automatically for you and you will see the results in an instant.

In addition to inflection point graphs by odds the new tables now also provide 15 additional analyses by ‘home odds divided by away odds quotient’ (HO/AO Quotient). The relationship between the home and away odds remains very constant throughout the ante post market. This allows identification of bets and their placement at any time during the ante post market, removing the need to place bets close to kick-off. In short, there are no more time restrictions and results should be more reliable.

The price per league remains sensible at £35.00 each.

We truly hope that you are going to love the new format of the tables and we would be very interested to hear any feedback on the new style table once you’ve had a chance to look at it.

Just as a side note, the available summer leagues have also been upgraded to the new format and we’ll send out update emails to all buyers in due course. However, we’ll wait with that until we have published all the supporting articles in order to avoid confusion for those who are in the middle of their summer league campaigns.

HDA Betting: Profit/Loss Simulation Tables
PRODUCT SUMMARY

  • Format: Excel .XLSX (compatible with Excel 2007 and higher)
  • File Size: between 1.72 MB and 4.55 MB each
  • Publisher: Hertis Services Ltd (formerly Soccerwidow Ltd); 6th revised edition
  • Profit/Loss Simulations within each Workbook: Inflection Point Graphs by Odds and HO/AO Quotient for Home Win, Draw, Away Win, Favourite & Underdog, plus a breakdown of individual teams’ performance in each bet type from both a home and away perspective.
  • Language: ENGLISH

By purchasing this product you agree to our Terms and Conditions and Privacy Policy.

After payment you will get the product download link(s) delivered immediately to your inbox. For that you will receive an email from GetDPD, our digital delivery partner.

Should your download link not arrive within 10 minutes after purchasing, please check your spam folder. We do sometimes receive reports from our clients that GetDPD emails land there occasionally. You can play it safe and allow within your email program emails with the endings: digitalproductdelivery.com (GetDPD) and soccerwidow.com (us).

‘Allowing’ communications from digitalproductdelivery.com and soccerwidow.com is actually quite important because we do update and/or upgrade products from time to time and you certainly don’t want to miss the free download link we will send out to buyers.

If you have any further questions please check our Frequently Asked Questions – HDAFU Tables

>>> buy your hdafu tables <<<

Comment for the Tables in their new format

It is very much an improvement on last years format and much much easier to use. It does take out a lot of the previous manual filtering and adjustments, which is important to minimise any errors made purely from manipulating the spreadsheets.

I do like its split between both, the odds and the HO/AO quotient and looking at it and comparing to previous. It certainly gives more insights to analyse. I also really like the time profile of the profit/loss over the 5 year period as this was one area I think last year I could have improved my portfolio with smarter decisions.

Michael

Finding a System Using the HO/AO Quotient

$
0
0

Our 6th generation of HDAFU tables introduces the HO/AO quotient as a selection criterion which has the effect of making your systems less volatile and your portfolio of systems more viable.

Furthermore, the HO/AO Quotient removes the need to stay in front of the computer in the last hour before kick-off and allows you to compile your portfolio of bets well in advance, hence reducing the stress factor and possible human error.

Image: StockLite (Shutterstock)

What is a HO/AO Quotient?

The division of HO (Home Odds) by AO (AO Odds) reflects the “strength” of the teams. This makes upcoming games comparable with past matches, of which the results are known.

When building the quotient, we’re not asking ourselves questions like “Are these teams really equal?” or, “Is the favourite priced correctly?” We do not recalculate 1X2 odds; we simply use market prices and assume that the bookmakers have taken statistics into account and reflected public opinion (market pressures) as well as they possibly could do when setting their odds.

The HO/AO quotient is therefore an ideal device for comparing an upcoming match with the nearest batch of equivalent games against teams of a similar perceived strength to the opponent under analysis.

If for example, Liverpool are 1.34 to beat West Ham and West Ham are 11.0 to beat Liverpool, it makes sense to look at comparable matches where other teams carried similar prices in their respective home and away games in the past.

How to Calculate the HO/AO Quotient

As an example we will use the match Arsenal against Liverpool on 22/12/2017.

The evening before the match, the home win (Arsenal) was priced at 2.60, and the away win (Liverpool) at 2.95.

For the HO/AO quotient you simply divide the home odds (HO) by the away odds (AO).

2.60 divided by 2.95 = 0.881

That’s it!

Of course, if you would use the odds at kick-off then your quotient will be different, the home win (Arsenal) was then priced at 2.68, and the away win (Chelsea) at 2.95.

2.68 divided by 2.95 = 0.908

We will have closer look at these difference in the course of this article and explore if they actually matter and how much they matter.

What does the HO/AO Quotient Tell Us About the Comparative Strength of Teams?

When looking at the 2013-18 EPL HDAFU table, the following classifications become apparent when dividing games into ‘perceived strength’:

  1. HO/AO: up to 0.225
    The home team is the clear favourite with a very good chance of winning (the home team is the overwhelming favourite)
    For example, Liverpool vs. Brighton on the 13/5/2018
  2. HO/AO: 0.226 to 0.499
    The home team is definitely stronger than the away team, but there is also a good chance of a draw in the game (fluctuating opinion between home or draw)
    For example, Swansea vs. Stoke on the 13/5/2018
  3. HO/AO: 0.500 to 0.788
    It is not really clear in which direction the game will develop (no overwhelming favourite)
    For example, West Ham vs. Everton on the 13/5/2018
  4. HO/AO: 0.789 to 1.751
    The chance of a draw is quite high as both teams are perceived to be of equal strength (no overwhelming favourite)
    For example, Stoke vs. Crystal Palace on the 05/05/2018
  5. HO/AO: over 1.752
    The home team is perceived as being much weaker than the away team; the public feels that it could be an away win (the perceived favourite is the away team)
    For example, Southampton vs. Man City on the 13/5/2018

If you are in the possession of the 2013-18 EPL HDAFU table then go to the data tab and check a few matches and their HO/AO quotients and see if you agree with the games being in the above classifications.

Alternatively, calculate the HO/AO quotients using before kick-off odds that you can retrieve from any odds comparison site.

Now, continue with the exercise and check against the actual distribution of results. You will quickly see that they hardly distribute according to the expectations (HO/AO clusters). That’s what makes 1X2 betting so very tricky and the HO/AO quotient so handy.

Finding a System Using the HO/AO Quotient

We now come to the practical part of this article. If you have not yet downloaded our HDAFU Show Table, then you can do it now here; all the following examples are being carried out using this show table.

It is a fully functional table and its only limitation is that it is an expired table and cannot be used for the forthcoming season. Of course, it can be used for backtesting its functionality against the previous season (2017-18).

The size of this Excel .XLSX workbook is 3.4 MB

>>> free epl hdafu table download <<<


(1) Find an HO/AO Cluster in the ‘IP’s by HOAO’ tab in which the Curve Goes Steadily Upwards

Table 1: P/L Simulation of ‘Backing the Draw’ in the first half

Above screenshot shows you ‘Backing the Draw’ in the first half.

It is a nice, steady upwards curve and stretched over almost a third of the whole graph. This is why we are going to look at this HO/AO cluster for this article.

(2) Check in the ‘System Picker’ tab what to Expect

Table 2: System Picker example


  1. The expected number of matches to bet on the following season: 53

    To diversify your portfolio, you are looking ideally for at least 500 bets in one season but you certainly want to avoid having too many small individual systems in your portfolio. Just remember, the more restrictive your selection criteria the higher the risk of deviation from the expectations.

    50 bets in an individual system is a very good number (that means that you only have to identify 10 different systems to populate a portfolio with 500 bets in total), and even better if it has been achieved over all five previous seasons.

  2. The expected hit rate: 39.62%

    Please keep in mind that the lower the hit rate the more volatile a system is to longer losing streaks. Here’s an article on that topic: The Science of Calculating Winning and Losing Streaks

    If your system has a probability of 40% to win then the maximum length of a losing streak may be as long as 8 bets in a row.

    Keep that in mind and try to avoid too many low hit rate systems in your portfolio.

    As a side note, you will be expecting with this system a hit rate of 39.62%. However, it is very unlikely that it will be absolutely spot on. Compared with the hit rates of the previous five seasons the average fluctuation (deviation) expected is 2.55% but it may be even as high as the maximum deviation which in this case was 5.48%.

    This is a risk measurement and I will address and explain the calculations and their interpretations in another article about ‘How to Construct a Portfolio’.

  3. The Zero Odds: 2.49

    This is actually the most important figure when using the HDAFU Tables to determine if you take the system in your portfolio of bets or not.

    Taking the expected deviation (2.55%) into account you are looking at ‘Zero’ odds between 2.34 and 2.65; even taking the max. deviation (5.48%) into account, the ‘Zero’ odds are still as low as 2.88.

    In this example, everything above the ‘Zero’ odds of 2.49 was a value bet! If you would have aimed constantly for odds above 2.88, you would have been playing on the absolutely safe side.

    As you are looking at a system with average odds of 3.44 (the figure below the ‘Zero odds’ in the above screenshot) the timing of your bet would hardly have mattered. Even if you don’t always have access to the highest odds in the market, e.g. because of territorial restrictions, then it would have been safe to include this system in your portfolio because of the likelihood of achieving draw odds above 2.49 (or even 2.88) ‘Zero’ odds.

    Again, as previously mentioned, the calculations and their interpretations will be addressed in detail in another article.


(3) Decide if to Include the System in your Portfolio

Our example above was definitely a system worthy of inclusion in the 2017-18 portfolio. It had everything you would be looking for:

  • 50 bets minimum per annum
  • an acceptable hit rate and
  • delightfully low ‘Zero’ odds for the draw

Feel free to check yourself how this system would have performed for you during the 2017-18 season.

Here’s the answer: In the end 55 bets were played, of which 21 won (38.18% hit rate) with a profit of over 1,500 units using 100 unit flat stakes.

Why does the HO/AO Quotient Make an Analysis Less Volatile?

Here’s a close up screenshot from the Inflection Point graph above (table 1) and the odds seem to be disorganised and unordered:

Table 3: Inflection Point graph – corresponding draw odds

The HO/AO Quotient is a device for grouping matches into ‘comparable strengths’ of the teams involved (home odds divided by away odds), with the draw variable removed.

If you would be picking your system by odds then draw odds up to 3.54 could be draws odds for all kind of matches; matches between a strong favourite at home, equally matched teams, or the favourite being the away team, and so on.

With the HO/AO Quotient in our example: 0.603 to 1.396 we are only targeting teams in group 3 ≫ It is not really clear in which direction the game will develop (no overwhelming favourite) and group 4 ≫ The chance of a draw is quite high as both teams are perceived to be of equal strength (no overwhelming favourite)

For example, if there is a strong favourite involved in the game then the HO/AO Quotient approach filters these games out, even if the draw odds may be lower than 3.54.

Using the HO/AO Quotient slims down the number of available bets to an average of 53 bets with an expected hit rate of 39.62%. The expected profit is: 2,046.60 units per annum when staking 100 units flat.

Would you have used the ‘IP’s by Odds’ instead you would have likely chosen the odds cluster from 3.30 to 3.65. This would have provided you with a higher number bets per annum (87) but with only a 33.33% expected hit rate and a lower profit expectation of 1,322.40 units. Furthermore, the system would have been more volatile: an expected deviation of 2.78% (as compared with 2.55%) with a maximum deviation of 6.66% (as compared with 5.48%).

By slimming down the number of bet candidates and targeting bet selection via the HO/AO quotient taking the strength of the teams into account, the system becomes less volatile.

Draw systems especially benefit from the HO/AO Quotient, but others as well.

At What Time Should the HO/AO Quotient be Calculated and Which Odds should be Used

The new winter league HDAFU Tables (for the 2018-19 season) use Football-Data.co.uk odds recorded on Friday evenings for weekend games and Mondays for week games.

Therefore, the closer to these times you calculate the HO/AO quotients for your system, the closer you are going to be to the HO/AO quotients calculated and used in the HDAFU simulations.

The odds you should use for the calculation should be the highest odds on the market (across all bookmakers) to get as close as possible to 100% implied probability and remove any overround.

Calculating the HO/AO Quotient at another Time

If you are for some reason unable to calculate the HO/AO quotient on Friday evenings for weekend games and Mondays for week games then please, don’t worry too much.

Here’s an example weekend from the first half of the 2017-18 EPL season:

Table 4: Calculating HO/AO Quotients at different times

As you can see all four matches that would have fitted the criteria of being in the HO/AO 0.603 to 1.396 quotient cluster would still have been in the group of betting candidates even when using odds at the close of the match.

Only the Swansea vs. Crystal Palace match may have drifted out of the cluster. The other three games remained solidly within their clusters so that it didn’t matter at all how their odds changed during the ante post market.

Bearing in mind that rapid odds movements normally only start within the last hour before kick off (after the release of team news), the easiest solution to avoid any errors in bet selection is simply not to calculate the HO/AO quotient too close to the kick off. Odds normally stay pretty stable during the whole ante post period.

However, should you calculate within the last few hours before kick-off then you should check the odds movements, especially for outliers, and also check the odds movements for matches that are just outside the chosen HO/AO cluster.

I hope this article has cleared up any confusion caused by the introduction of the HO/AO Quotient to our 6th generation HDAFU tables. However, if you are still not sure, then please feel free to ask any questions via the comment section below.

>>> buy your hdafu tables <<<

Viewing all 44 articles
Browse latest View live